• Individual Investor
  • Individual Investor

Three ways to invest in Thrivent funds

We’re here to help you invest with confidence.

MUTUAL FUNDS

Thrivent Account

You can purchase mutual funds right on our site with an online account.

Invest with a Thrivent account

  • Set up an account starting with as little as $50 per month.1
  • Access your online account at your convenience.
  • Purchase funds without transaction fees or sales charges.

MUTUAL FUNDS & ETFS

Financial Professional

For guidance when investing, ask a financial professional about investing in Thrivent mutual funds & ETFs.

Invest with a financial professional

  • Receive investment help from an experienced professional.
  • Build a relationship through in-person meetings.
  • Get help planning for life’s goals such as saving and retirement.
  • Additional fees may apply.

MUTUAL FUNDS & ETFS

Brokerage Account

If you already have a brokerage account, our mutual funds & ETFs can be purchased through online brokerage platforms by searching for Thrivent Mutual Funds and ETFs.

Invest with a brokerage account

  • Add Thrivent Mutual Funds and ETFs to your investments within your existing portfolio.
  • Take advantage of your account to keep your investments in one place.
  • Additional fees may apply.

Not quite ready?

We want you to invest your money wisely and with confidence.
Here are some other options that may help you.

  • Take our quiz to determine your personal investment style.
  • Talk to your financial advisor about ETFs.
  • Sign up for our monthly investing insights newsletter.


Need more help?

If you need assistance, we’re here to help. Reach out to us via the phone, email, and support page information below.


This ETF is different from traditional ETFs. Traditional ETFs tell the public what assets they hold each day. This ETF will not. This may create additional risks for your investment. For example:

 - You may have to pay more money to trade the ETF’s shares. This ETF will provide less information to traders, who tend to charge more for trades when they have less information.

 - The price you pay to buy ETF shares on an exchange may not match the value of the ETF’s portfolio. The same is true when you sell shares. These price differences may be greater for this ETF compared to other ETFs because it provides less information to traders.

 - These additional risks may be even greater in bad or uncertain market conditions.

 - The ETF will publish on its website each day a “Proxy Portfolio” designed to help trading in shares of the ETF. While the Proxy Portfolio includes some of the ETF’s holdings, it is not the ETF’s actual portfolio.

The differences between this ETF and other ETFs may also have advantages. By keeping certain information about the ETF secret, this ETF may face less risk that other traders can predict or copy its investment strategy. This may improve the ETF’s performance. If other traders are able to copy or predict the ETF’s investment strategy, however, this may hurt the ETF’s performance. For additional information regarding the unique attributes and risks of the ETF, see the Principal Risks section of the prospectus.

1 New accounts with a minimum investment amount of $50 are offered through the Thrivent Mutual Funds "automatic purchase plan." Otherwise, the minimum initial investment requirement is $2,000 for non-retirement accounts and $1,000 for IRA or tax-deferred accounts, minimum subsequent investment requirement is $50 for all account types. Account minimums for other options vary.

Thrivent ETFs may be purchased through your financial professional or brokerage platforms.

Contact your financial professional or brokerage firm to understand minimum investment amounts when purchasing a Thrivent ETF.

Now leaving ThriventFunds.com


You're about to visit a site that is neither owned nor operated by Thrivent Mutual Funds.

In the interest of protecting your information, we recommend you review the privacy policies at your destination site.

2nd QUARTER 2024 MARKET REVIEW

Goldilocks returns

07/11/2024

African American male analyst looking at multiple market screens
WRITTEN BY:
Chief Investment Strategist
WRITTEN BY:
Steve Lowe, CFA,Chief Investment Strategist

Thrivent Asset Management Contributors to this report: John Groton, Jr., CFA, director of administration and materials & energy research; Matthew Finn, CFA, head of equity mutual funds; Kent White, CFA, head of fixed income mutual funds; and Jared Hagen, senior investment product specialist


Key points

Equities show power

While setting records, much of the strength was found in large technology-related companies.

Fixed income holds steady

Second quarter started weak in the Treasury market but recovered as inflation data stabilized.


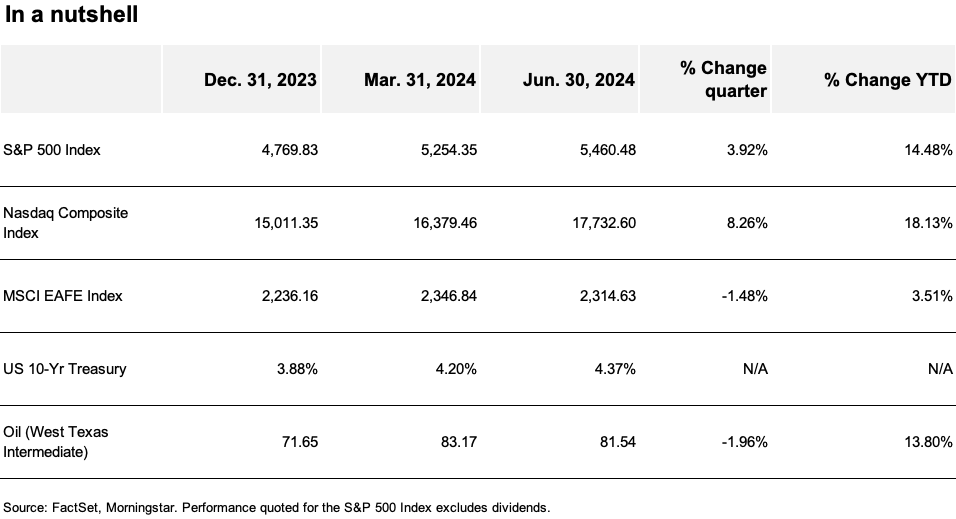
2nd Quarter 2024 Market Review chart: Previous year end, previous two months' end, percent change month and YTD

Stock and bond markets got off to a difficult start in the second quarter after the March employment report exceeded even the most bullish assumptions and inflation data was generally higher than expected. But, as the quarter evolved, an environment of slowing economic growth and slowing inflation resumed. Consumer confidence dipped, retail sales slipped, job growth moderated, job postings declined and inflation ticked lower, though none of these indicators raised concerns that the economy was slowing faster than expected. Instead, the second quarter proved to be something of a goldilocks environment, where growth was slow (but not too slow), sustaining optimism that the economy may see a soft landing, eventual interest rate cuts and a recovery in growth next year.

While inflation was slower to decline than the market anticipated over the period—pushing back expectations for interest rate cuts—services price inflation showed encouraging signs of slowing and goods price inflation has been negative, or deflating. While overall inflation remains above the U.S. Federal Reserve’s (Fed) target level, signs of a sustained (if slow) decline in its rate of growth allowed the Fed to maintain its expectation for an interest rate reduction in 2024. The latest Fed projections show just one cut of 0.25%—significantly less than the three rate cuts it anticipated earlier this year.  

The S&P 500® Index again set multiple new highs over the quarter, rising 3.92% and bringing its year-to-date gain to 14.48%. However, gains were once again concentrated in the largest companies, with NVIDIA Corporation alone accounting for approximately 30% of the S&P 500 Index’s year-to-date returns.

The Treasury market was weaker in the early months of the quarter as yields rose on fears of stronger growth and high inflation, but recovered as data moderated. Benchmark 10-year Treasury yields ended the quarter at 4.37%, 0.17% higher than at the end of March. Generally speaking, corporate bond markets enjoyed the expectations of higher-for-longer income creating sustained demand. This helped the Bloomberg U.S. Aggregate Bond Index generate a slightly positive (0.07%) return over the quarter.

RELATED ARTICLES

3rd Quarter 2024 Market Outlook: Waiting for the Fed

With static interest rates and mixed economic data, we favor stocks over bonds, growth over value and domestic over international.

Early investing: How much are you missing out on every day you don’t invest?

By starting your investment plan now, you may be able to achieve the long-term results you’re seeking with just a fraction of the dollars you’d need to invest.

Drilling down

U.S. stocks again set new highs

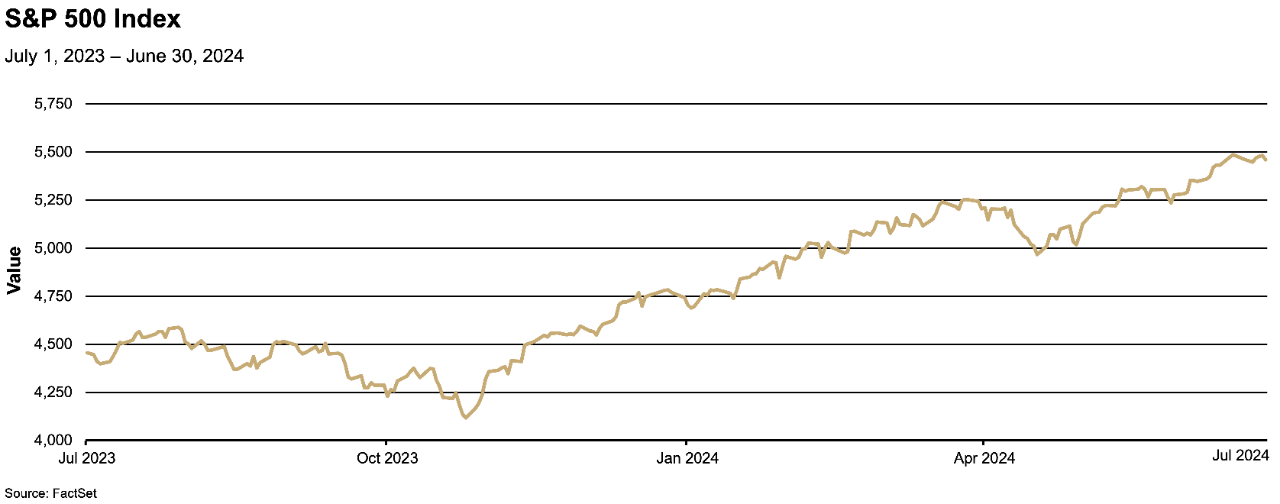
The S&P 500 Index rose 3.92% over the second quarter, but the market’s strength remained narrowly concentrated in large technology and technology-related companies, with growth stocks significantly outperforming more value-orientated stocks. Over the period, the index rose from 5,254.35 at the end of March to 5,460.48 at the end of June. The total return of the S&P 500 Index (including dividends) was 4.28%.  

The NASDAQ Composite Index® rose 8.26% over the quarter, from 16,379.46 at the end of March, to 17,732.60 at the end of June, bringing its year-to-date gain to 18.13%.

Chart depicting the value of the S&P 500 Index from July 2023 to July 2024.

Retail sales cool

After rising well above consensus expectations in March, the monthly change in retail sales declined in April and rose just 0.1% in May, below consensus expectations closer to 0.2%. While year-on-year changes have remained high, retail sales clearly cooled over the second quarter. Even food and beverage sales, which had been a stable source of strength in real sales, slipped in May, falling 0.4% relative to April’s figures. Furniture and building material sales also remained under pressure as these sectors await a recovery in the housing market.

Job growth remains healthy

While March’s employment data was exceptionally strong, raising concerns about growth being too hot early in the quarter, the data softened as the months progressed. Employment in June rose by 206,000, while the April and May employment figures were revised significantly lower, according to the Department of Labor’s July 5 report. The unemployment rate in June remained little changed at 4.1%. The rise in average hourly earnings slowed, though at a year-over-year level (3.9%) that is still higher than inflation.

Sector strength was technology led

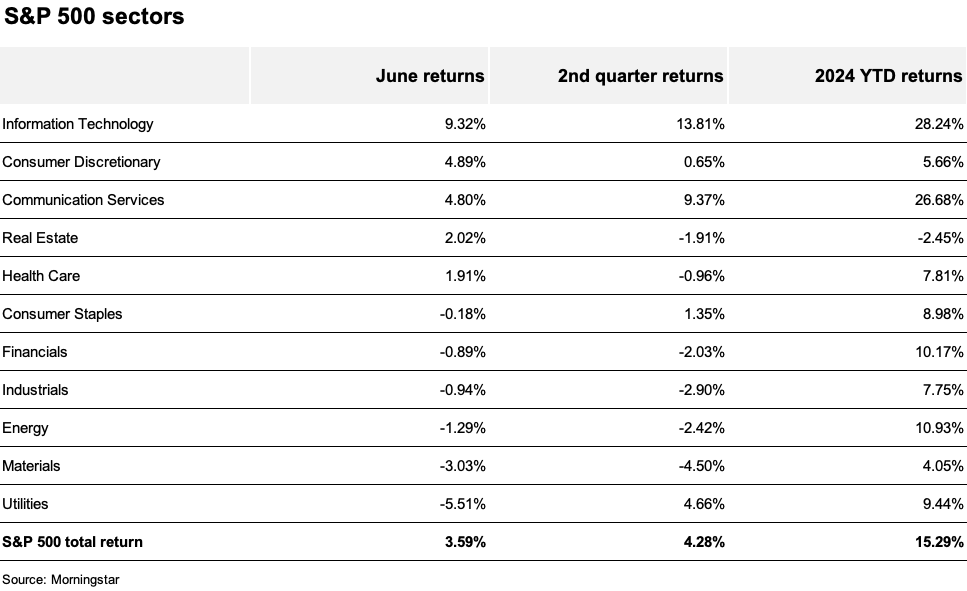
Of the S&P 500 Index’s 11 sectors, five posted positive performance while the remaining six sectors declined over the quarter. The information technology and communication services sectors drove the Index’s performance, rising 13.81% and 9.37% respectively over the period. The materials sector was the weakest performing sector (down 4.50%), followed by industrials (down 2.90%) and energy (down 2.42%).

The chart below shows the results of the 11 sectors for the past month, second quarter and year to date.

2nd Quarter 2024 Market Review: June returns, 2nd quarter returns and year-to-date returns of the S&P 500 sectors

Treasury yields rise modestly

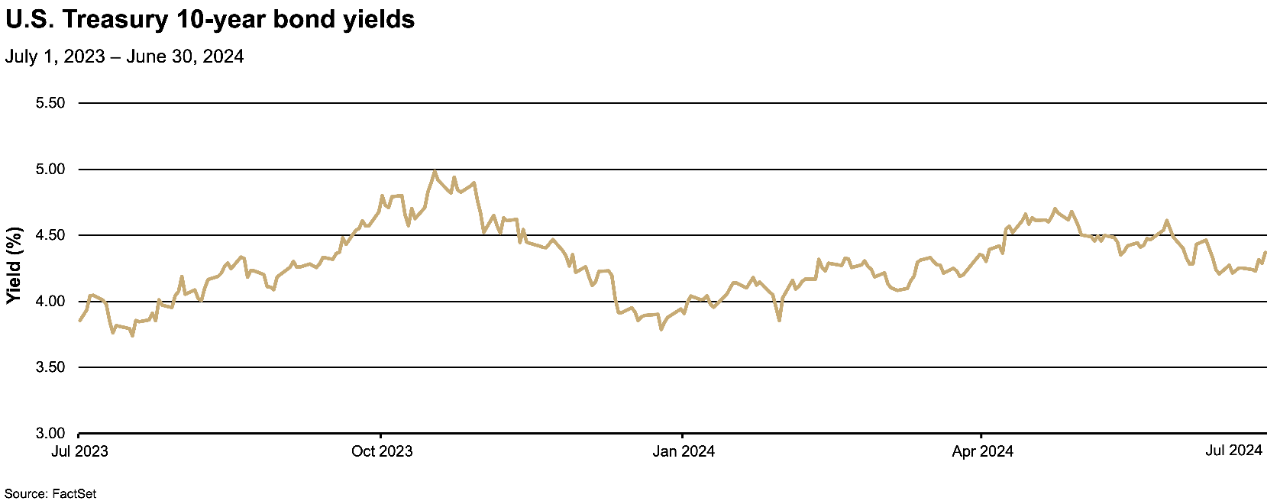
The yield on 10-year U.S. Treasuries rose over the quarter, from 4.20% at the end of March to 4.37% at the end of June. Concerns about strong employment and higher inflation pushed yields up early in the period, but they drifted lower as economic and inflation data renewed investor confidence that the economy would both slow and achieve a soft landing. With expectations for interest rate cuts pushed back over the period, shorter-dated Treasury yields remained high. Longer-dated yields, including the benchmark 10-year note, stayed elevated on renewed caution over the path of the government’s fiscal policy.

The Bloomberg U.S. Aggregate Bond Index rose 0.07% over the quarter, bringing its year-to-date loss to -0.71%.

As interest rates rose, the Bloomberg U.S. Aggregate Bond Index fell 1.41% over the quarter.

2nd Quarter 2024 Market Review chart: US Treasury 10-year bond yields July 2023-June 2024

Corporate earnings projections keep rising

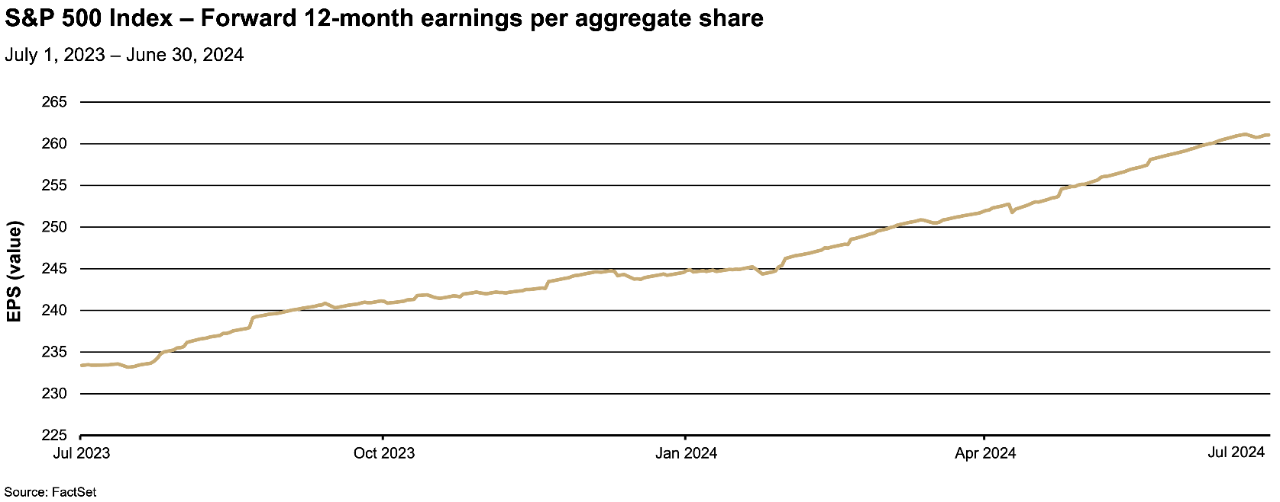
Corporate 12-month earnings projections for the S&P 500 Index continued their steady rise since the start of the year. Earnings per share (EPS) estimates rose 3.84% during the quarter, a sign of increasing optimism about the outlook for economic growth and for companies, particularly the larger technology and technology-related companies, to generate increasing revenue.

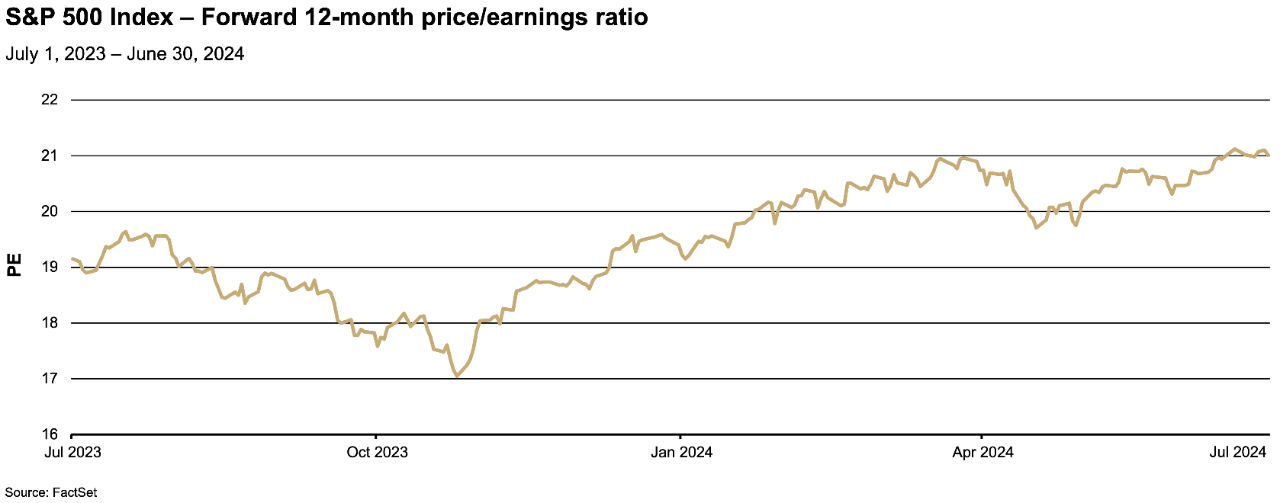
2nd Quarter 2024 Market Review chart: S&P 500 Index - Forward 12-month price earnings ratio July 2023 to June 2024

Forward P/E ratios rise modestly

The forward 12-month price-earnings ratio (P/E) of the S&P 500 Index rose over the second quarter, from 20.96 at the end of March to 21.01 at the end of June. A higher P/E ratio means stocks are more expensive relative to their EPS.

Chart depicting the S&P 500 Index - Forward 12-month price earnings/ratio July 2023-June 2024

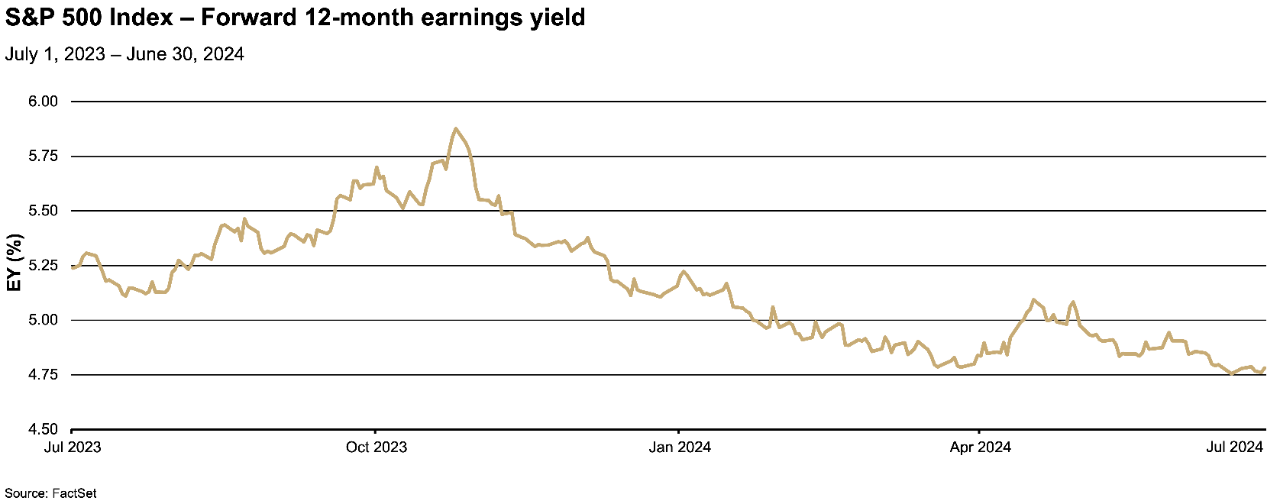
The forward 12-month earnings yield, which is the inverse of P/E, was essentially unchanged over the period. At 4.78%, the forward 12-month earnings yield remained above the 4.37% yield offered by 10-year U.S. Treasuries at the end of June, but the gap continues to narrow.  The 12-month forward earnings yield can be helpful in comparing equity earnings yields with current bond yields.

2nd Quarter 2024 Market Review chart: S&P 500 Index - Forward 12-month earnings yield July 2023-June 2024

Dollar gains vs. euro and yen

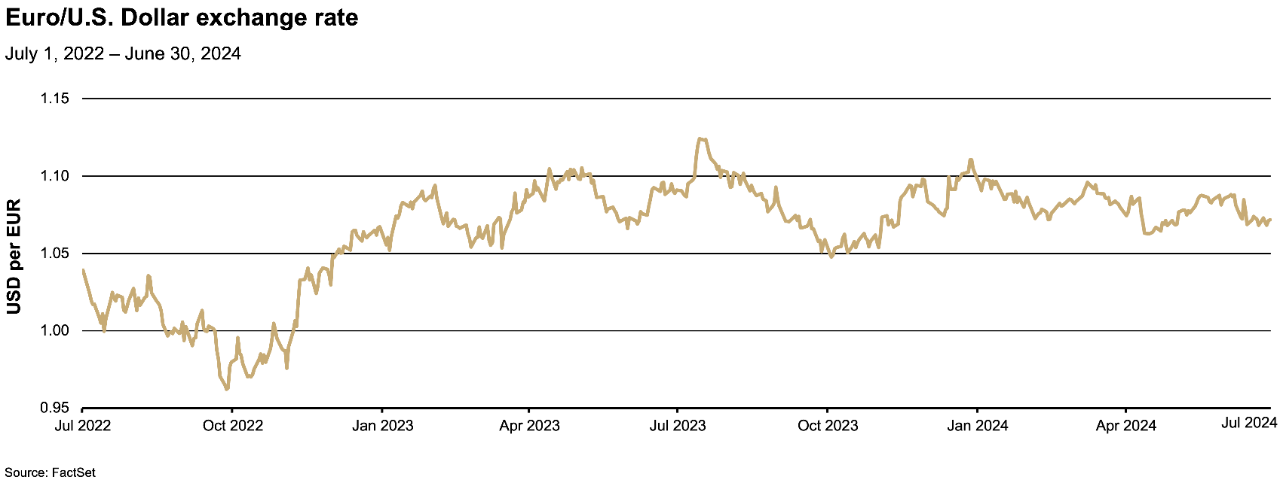
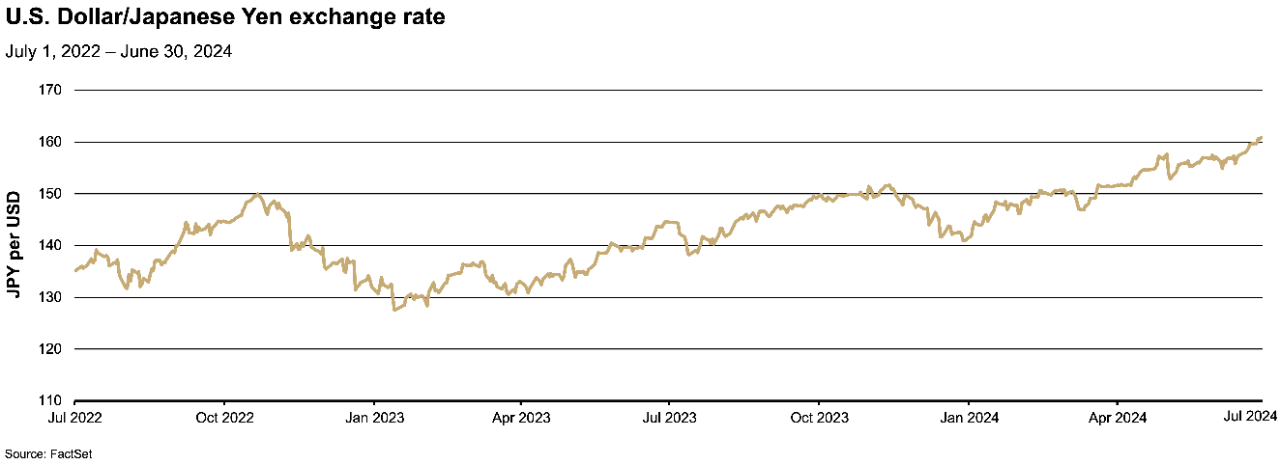
The U.S. dollar appreciated versus the euro and Japanese yen during the quarter, with the euro falling 0.76% relative to the dollar, and the dollar rising 6.29% relative to the yen. Expectations that interest rate cuts would be pushed back while the economy remained relatively robust helped support the dollar.

2nd Quarter 2024 Market Review chart: Euro US Dollar exchange rate July 2022-June 2024
2nd Quarter 2024 Market Review chart: US Dollar/Japanese Yen exchange rate July 2022-June 2024

Oil prices recede

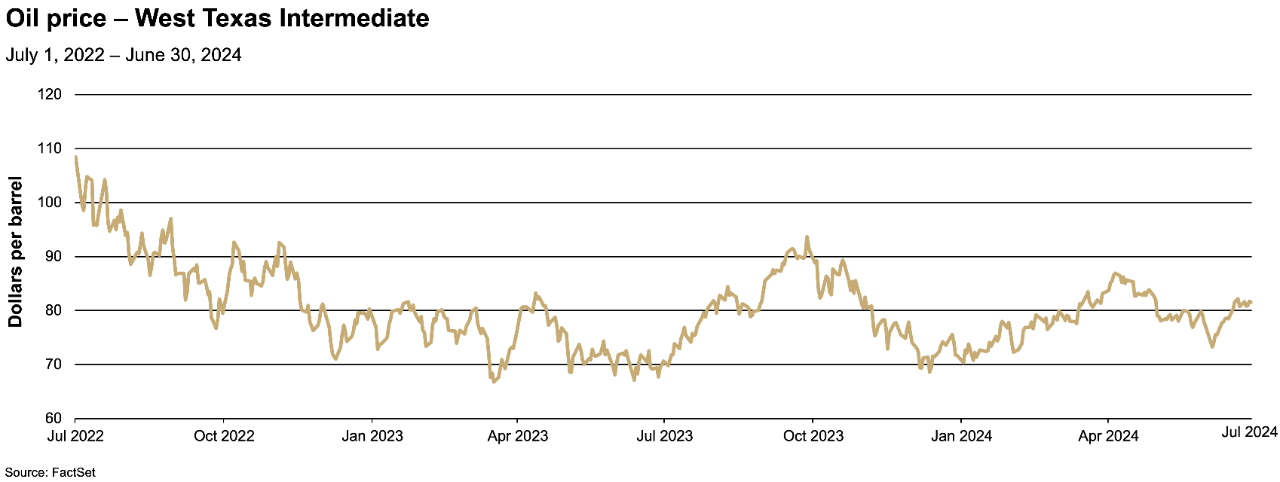
Oil prices fell over the quarter, with the price of West Texas Intermediate, a grade of crude oil used as a benchmark in oil pricing, declining 1.96%, from $83.17 at the end of March to $81.54 at the end of June. Prices rose early in the period on the back of increased tensions in the Middle East, but retreated after OPEC+ (a consortium of oil producing nations including Saudi Arabia and Russia), announced plans to gradually add back production.

Gasoline prices at the pump remained stable over the quarter, falling by only $0.01, from $3.57 at the end of March to $3.56 at the end of June.

2nd Quarter 2024 Market Review: Oil price - West Texas Intermediate July 2022-June 2024

Gold rises again

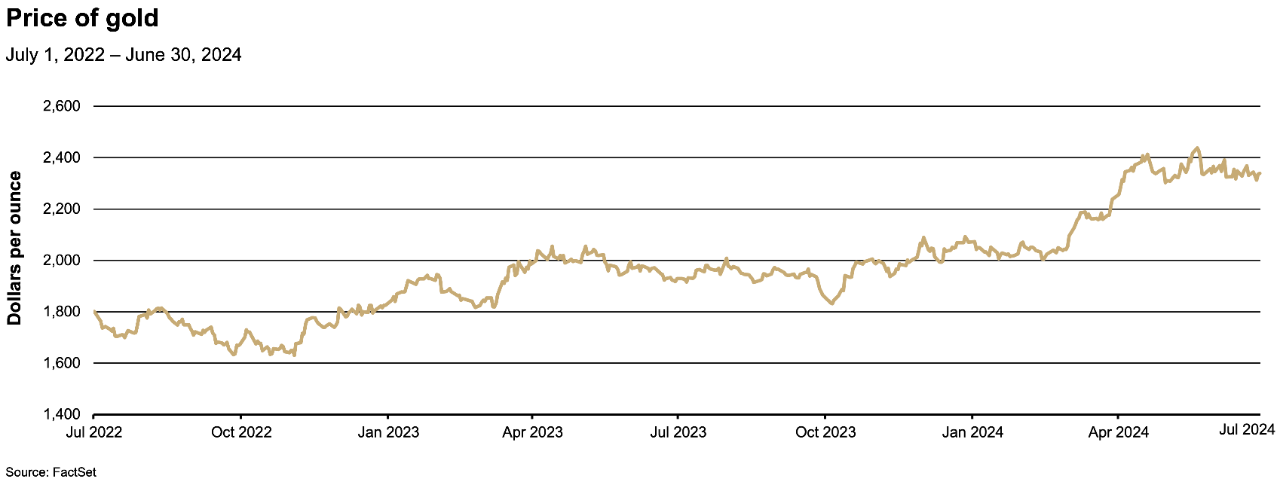
Gold prices rose again in the second quarter (up 4.52%), bringing its year-to-date gain to 12.93%. Gold prices have been supported by expectations of falling interest rates, which diminishes the opportunity cost of holding gold, as well as foreign demand and the desire to hold assets that could be a hedge against political risk.

2nd Quarter 2024 Market Review chart: Price of gold July 2022-June 2024

International equities decline

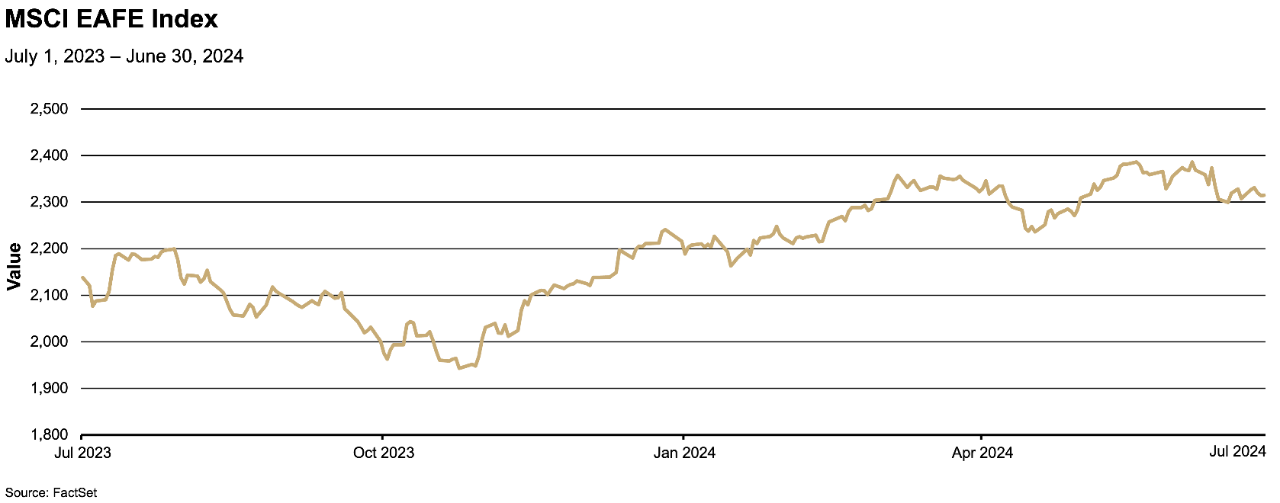
International equities, as measured by the MSCI EAFE Index, fell 1.48% over the second quarter, lowering its year-to-date gain to 3.51%. The Index had a stronger start to the quarter, but fell back in June when the European parliamentary election rattled eurozone markets after far-right parties made surprising gains, raising concerns about the region’s commitment to fiscal spending targets.

2nd Quarter 2024 Market Review chart: MSCI EAFE Index July 2023-June 2024

Before making a change in your investment portfolio, you may wish to consult with a financial professional to determine how that may align with your long-term goals and objectives.

Media contact: Callie Briese, 612-844-7340callie.briese@thrivent.com

All information and representations herein are as of 07/11/2024, unless otherwise noted.

The views expressed are as of the date given, may change as market or other conditions change, and may differ from views expressed by other Thrivent Asset Management, LLC associates. Actual investment decisions made by Thrivent Asset Management, LLC will not necessarily reflect the views expressed. This information should not be considered investment advice or a recommendation of any particular security, strategy or product. Investment decisions should always be made based on an investor's specific financial needs, objectives, goals, time horizon, and risk tolerance.

This article refers to specific securities which Thrivent Mutual Funds may own. A complete listing of the holdings for each of the Thrivent Mutual Funds is available on thriventfunds.com.

The S&P 500® Index is a market-cap weighted index that represents the average performance of a group of 500 large-capitalization stocks.

NASDAQ – National Association of Securities Dealers Automated Quotations – is an electronic stock exchange with more than 3,300 company listings.

The Bloomberg U.S. Aggregate Bond Index is an unmanaged index considered representative of the U.S. investment-grade, fixed-rate bond market.

The MSCI EAFE Index is an unmanaged index designed to represent the performance of large and mid-cap securities across 21 developed markets, including countries in Europe, Australasia and the Far East, excluding the U.S. and Canada.

Any indexes shown are unmanaged and do not reflect the typical costs of investing. Investors cannot invest directly in an index.

Past performance is not necessarily indicative of future results.

Related Insights