Tax Day is April 15, 2024. Visit the Tax Resource Center to help you prepare.

Three ways to buy Thrivent funds

We’re here to help you invest with confidence.

MUTUAL FUNDS

Thrivent Account

You can purchase mutual funds right on our site with an online account.

Buy with a Thrivent account

  • Set up an account starting with as little as $50 per month.1
  • Access your online account at your convenience.
  • Purchase funds without transaction fees or sales charges.

MUTUAL FUNDS & ETFS

Financial Professional

For guidance when investing, ask a financial professional about buying Thrivent mutual funds & ETFs.

Buy with a financial professional

  • Receive investment help from an experienced professional.
  • Build a relationship through in-person meetings.
  • Get help planning for life’s goals such as saving and retirement.
  • Additional fees may apply.

MUTUAL FUNDS & ETFS

Brokerage Account

If you already have a brokerage account, our mutual funds & ETFs can be purchased through online brokerage platforms by searching for Thrivent Mutual Funds and ETFs.

Buy with a brokerage account

  • Add Thrivent Mutual Funds and ETFs to your investments within your existing portfolio.
  • Take advantage of your account to keep your investments in one place.
  • Additional fees may apply.
Not quite ready?

We want you to invest your money wisely and with confidence.
Here are some other options that may help you.

  • Take our quiz to determine your personal investment style.
  • Talk to your financial advisor about ETFs.
  • Sign up for our monthly investing insights newsletter.


Need more help?

If you need assistance, we’re here to help. Reach out to us via the phone, email, and support page information below.


This ETF is different from traditional ETFs. Traditional ETFs tell the public what assets they hold each day. This ETF will not. This may create additional risks for your investment. For example:

 - You may have to pay more money to trade the ETF’s shares. This ETF will provide less information to traders, who tend to charge more for trades when they have less information.

 - The price you pay to buy ETF shares on an exchange may not match the value of the ETF’s portfolio. The same is true when you sell shares. These price differences may be greater for this ETF compared to other ETFs because it provides less information to traders.

 - These additional risks may be even greater in bad or uncertain market conditions.

 - The ETF will publish on its website each day a “Proxy Portfolio” designed to help trading in shares of the ETF. While the Proxy Portfolio includes some of the ETF’s holdings, it is not the ETF’s actual portfolio.

The differences between this ETF and other ETFs may also have advantages. By keeping certain information about the ETF secret, this ETF may face less risk that other traders can predict or copy its investment strategy. This may improve the ETF’s performance. If other traders are able to copy or predict the ETF’s investment strategy, however, this may hurt the ETF’s performance. For additional information regarding the unique attributes and risks of the ETF, see the Principal Risks section of the prospectus.

1 New accounts with a minimum investment amount of $50 are offered through the Thrivent Mutual Funds "automatic purchase plan." Otherwise, the minimum initial investment requirement is $2,000 for non-retirement accounts and $1,000 for IRA or tax-deferred accounts, minimum subsequent investment requirement is $50 for all account types. Account minimums for other options vary.

Thrivent ETFs may be purchased through your financial professional or brokerage platforms.

Contact your financial professional or brokerage firm to understand minimum investment amounts when purchasing a Thrivent ETF.

Now leaving ThriventFunds.com


You're about to visit a site that is neither owned nor operated by Thrivent Mutual Funds.

In the interest of protecting your information, we recommend you review the privacy policies at your destination site.

Understanding mutual fund performance

08/15/2023
08/15/2023
Middle-aged Black man at home relaxing in a chair and looking at this phone while his small white dog rests in his lap.t his phone.

Once you’ve decided that mutual funds are right for your investing needs, how do you make sure you’re choosing the right one for you? Looking at how a fund has performed is one of many important considerations when selecting investments. Develop a deeper understanding of mutual fund performance.

The mutual fund industry adheres to strict standards when publishing or providing mutual fund portfolio performance data. This data follows common standards with the intent to make it fair and balanced when potential investors compare various options. If you’ve tried to look at fund performance data on a website or in a prospectus, then you know that “comprehensive” is a good word to describe the amount of information available. “Confusing” might be another word you’d use when trying to weed through all of the numbers, but if you know what to look for, you can quickly size up different funds and find one that’s right for you. Keep in mind that past performance is not indicative of future results, but seeing how a fund has performed over time may help provide some insight into how it historically has been managed.

Start with goals and risk

Before diving into fund performance, you should first have a clear sense of your financial goals and risk tolerance. Once you know what you’re saving for, when you’ll need the money, and how comfortable you are with different levels of fluctuation in your account values, you can more easily narrow your choices. Most funds will provide a statement of investment objective and the relative risk of the fund when compared to other funds. These two pieces of information may provide you with enough information to know if a fund is in line with your needs. Once you find a fund that seems to match your goals and risk tolerance, the next step is to take a deeper look at the fund performance.

Key performance indicators

Here are some of the typical values used to determine fund performance:

Net Asset Value (NAV)
The NAV is the fund’s value or price per share. The NAV is calculated by dividing the total value of all the fund’s assets (minus its liabilities) by the number of shares issued.  NAVs are only calculated once per day, after the market has closed.

Daily NAV Change
Since mutual funds are only priced once a day, the daily NAV change is the difference between the fund’s most recent price per share and its price from the prior day. The daily NAV change can be shown as a dollars-and-cents change or a percentage change.

Returns
Mutual fund performance is usually presented as a total return. Total returns include both the fund’s change in value and the reinvestment of any dividends, capital gains, or interest payments.

Average Annualized or Trailing Returns
Average annualized returns, also known as trailing returns, illustrate fund performance over a specific time period, usually looking backward from a recent month or quarter-end. The most common time periods include three months, year-to-date, 1 year, 3 year, 5 year, 10 year and since inception.

Calendar Year Returns
Mutual funds will also often show calendar year returns which illustrate how a fund performed from January 1 to December 31 of that particular year. This allows you to see how the fund performed during specific historical time periods.

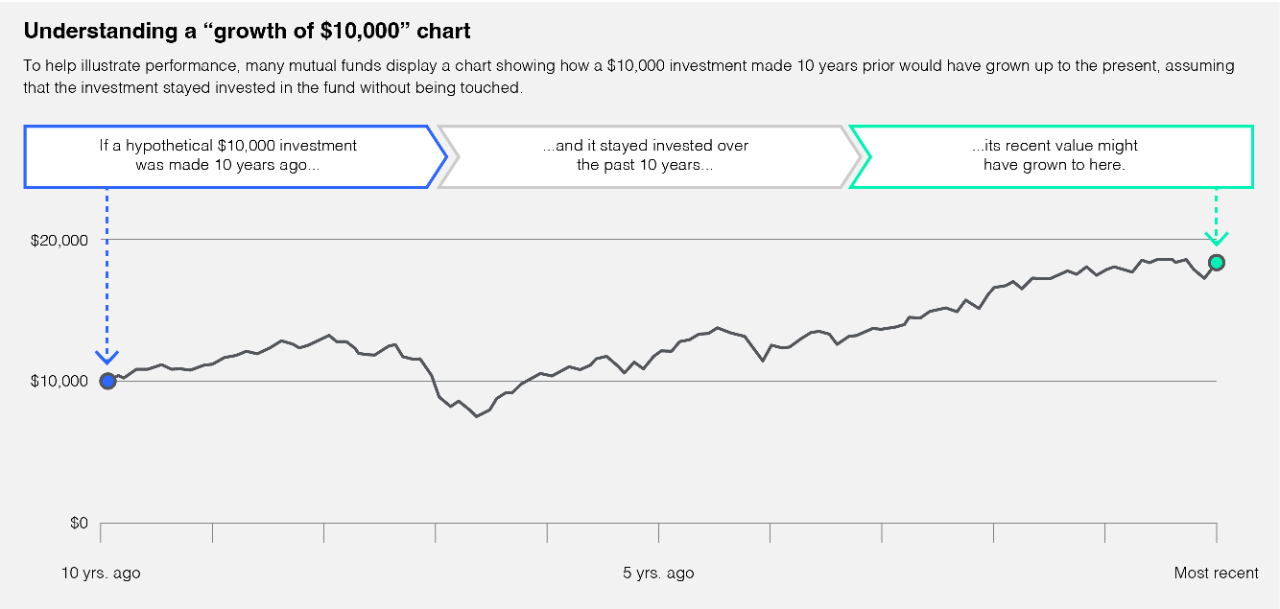
Growth of a $10,000 Investment
Below is an example of a chart many mutual funds present to demonstrate how a $10,000 investment in that fund would’ve changed over time. These charts typically go back either ten years or back to the initial launch of the fund.

This chart illustrates a hypothetical example of how a $10,000 investment made 10 years ago would have increased in value, assuming the investment stayed in a fund without making any changes to it.

Hypothetical example is for illustrative purposes only.

Mutual fund benchmarks

Listings of fund performance will usually include the fund’s benchmarks to provide a reference point for measurements. There are two common types of benchmarks:

Index Benchmark
A benchmark like the S&P S&P 500® Index or the Russell 2000 Index illustrates how a fund performed against large segments of the market. Index benchmarks are most meaningful when the fund invests in the same types of securities as the index does. Be careful not to compare the performance of a bond fund with that of a stock index!

Peer Group Benchmark
A benchmark based on similarly-structured funds enables a more “apples-to-apples” comparison of fund performance. A peer group benchmark may show the returns of the median fund in the peer group for each particular time period. Sometimes the fund will show its percentile ranking within the peer group, which tells you how many of its peers it outperformed. A search on the internet may lead you to several options of firms that provide peer benchmark data, or the mutual fund company itself may provide that in its fund data fact sheets.

What Thrivent Mutual Funds offers

One important aspect of our active management approach is the care and thought that go into selecting indexes and peer groups to serve as benchmarks when comparing fund performance. We believe in delivering the most complete overview for each and every fund by selecting indexes that are similar in style with our funds (like large capitalization indexes to compare with a fund made up of primarily large capitalization securities) or peer groups focused on funds with similar investment objectives to our funds. Now, that’s something we can all understand. When you choose to invest with Thrivent Mutual Funds, you’ll benefit from the expertise of our investment professionals and the convenience and choices we provide to make investing easier.


Related insights

03/26/2024

A skeptic’s eye helps drive performance for Thrivent Mid Cap Value Fund

A skeptic’s eye helps drive performance for Thrivent Mid Cap Value Fund

A skeptic’s eye helps drive performance for Thrivent Mid Cap Value Fund

Deep proprietary research helped Thrivent Mid Cap Value Fund Manager Graham Wong manage both ups and downs of the first four years of the fund’s inception in March 2020.

Deep proprietary research helped Thrivent Mid Cap Value Fund Manager Graham Wong manage both ups and downs of the first four years of the fund’s inception in March 2020.

03/26/2024

Market Update [VIDEO]

03/26/2024

March 2024 Thrivent market & economic update [VIDEO]

March 2024 Thrivent market & economic update [VIDEO]

March 2024 Thrivent market & economic update [VIDEO]

Learn what the latest economic trends could mean for you. Thrivent investment leaders shared their perspectives on the health of the markets and economy, insights on inflation and interest rates and the current outlook for smaller companies across the U.S. at a live event March 19.

Learn what the latest economic trends could mean for you. Thrivent investment leaders shared their perspectives on the health of the markets and economy, insights on inflation and interest rates and the current outlook for smaller companies across the U.S. at a live event March 19.

03/26/2024