Three ways to invest in Thrivent funds

We’re here to help you invest with confidence.

MUTUAL FUNDS

Thrivent Account

You can purchase mutual funds right on our site with an online account.

Invest with a Thrivent account

  • Set up an account starting with as little as $50 per month.1
  • Access your online account at your convenience.
  • Purchase funds without transaction fees or sales charges.

MUTUAL FUNDS & ETFS

Financial Professional

For guidance when investing, ask a financial professional about investing in Thrivent mutual funds & ETFs.

Invest with a financial professional

  • Receive investment help from an experienced professional.
  • Build a relationship through in-person meetings.
  • Get help planning for life’s goals such as saving and retirement.
  • Additional fees may apply.

MUTUAL FUNDS & ETFS

Brokerage Account

If you already have a brokerage account, our mutual funds & ETFs can be purchased through online brokerage platforms by searching for Thrivent Mutual Funds and ETFs.

Invest with a brokerage account

  • Add Thrivent Mutual Funds and ETFs to your investments within your existing portfolio.
  • Take advantage of your account to keep your investments in one place.
  • Additional fees may apply.

Not quite ready?

We want you to invest your money wisely and with confidence.
Here are some other options that may help you.

  • Take our quiz to determine your personal investment style.
  • Talk to your financial advisor about ETFs.
  • Sign up for our monthly investing insights newsletter.


Need more help?

If you need assistance, we’re here to help. Reach out to us via the phone, email, and support page information below.


1 New accounts with a minimum investment amount of $50 are offered through the Thrivent Mutual Funds "automatic purchase plan." Otherwise, the minimum initial investment requirement is $2,000 for non-retirement accounts and $1,000 for IRA or tax-deferred accounts, minimum subsequent investment requirement is $50 for all account types. Account minimums for other options vary.

Thrivent ETFs may be purchased through your financial professional or brokerage platforms.

Contact your financial professional or brokerage firm to understand minimum investment amounts when purchasing a Thrivent ETF.

Now leaving ThriventFunds.com


You're about to visit a site that is neither owned nor operated by Thrivent Mutual Funds.

In the interest of protecting your information, we recommend you review the privacy policies at your destination site.

2nd QUARTER 2025 MARKET REVIEW

Stocks plummeted and rebounded

07/15/2025

WRITTEN BY:
Chief Investment Strategist
WRITTEN BY:
Steve Lowe, CFA,Chief Investment Strategist

Thrivent Asset Management contributors to this report: John Groton, Jr., CFA, director of administration and materials & energy research; Matthew Finn, CFA, head of equity mutual funds; Kent White, CFA, head of fixed income mutual funds; and Charles Hofstrom, CFA, senior product specialist


Key points

High volatility

Volatility levels at heights not seen since pandemic affecting both stocks and bonds.

Negative and positive

Gross-domestic product was lowered from expectations, but employment numbers were more positive.


Second-quarter benchmark returns

Table summarizing key market indicators as of December 31, 2024, March 31, 2025, June 30, 2025, along with their quarter and year-to-date percentage changes.

What mattered in the second quarter

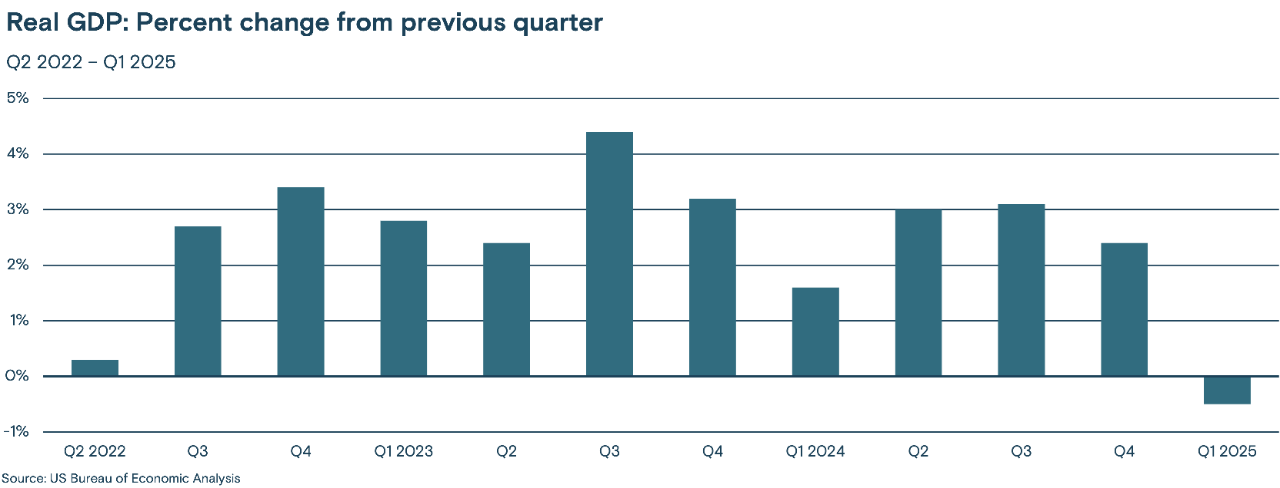
The economy: It was a volatile quarter as investors struggled to assess the impact of President Donald Trump’s economic policies. Weaker consumer and business surveys largely reflected this uncertainty, while a cloudier outlook also was reflected in consensus expectations for economic data. Nevertheless, the core measures of economic activity were generally in line with expectations for an economy that is showing signs of weakening, but is likely to remain resilient. Final first-quarter gross domestic product (GDP) was revised lower to -0.5%, largely due to a rush to import goods ahead of expected tariffs. Retail sales were generally weak while employment data surprised to the upside in June.

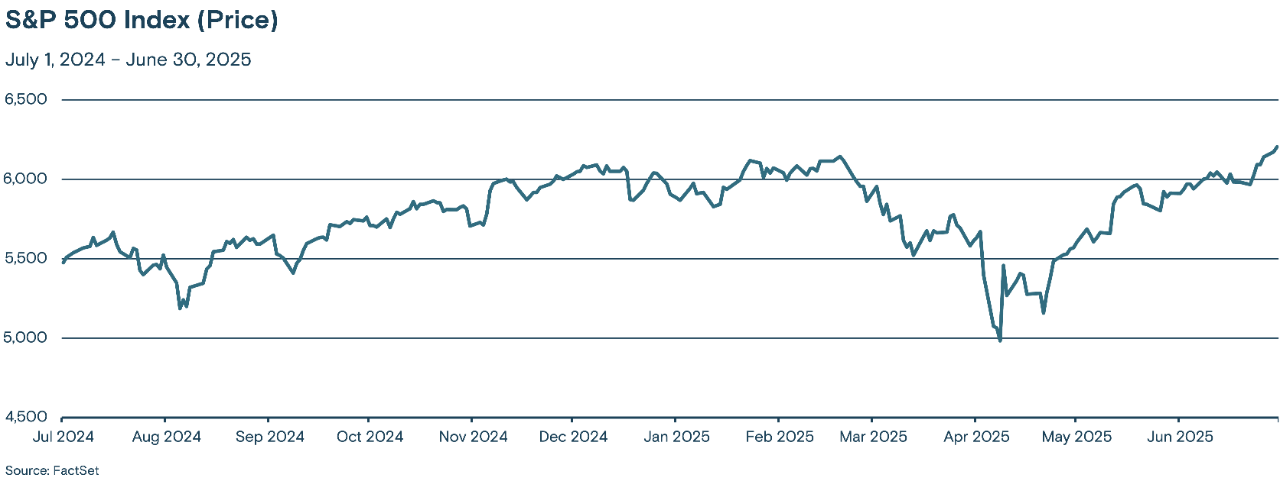
Stocks: The benchmark S&P 500® Index fell nearly 20% from its February highs to its early April lows and then sharply rebounded 9.4% in a single day—one of its largest one-day rallies in the last century. Unsurprisingly, volatility—as measured by the CBOE Volatility Index (VIX)—reached levels not seen since the COVID-19 pandemic. Despite high volatility stocks ended the quarter near new highs, driven by robust earnings, delays in implementing the announced tariffs and strong gains in large technology-related companies. The Magnificent 7 rose 18.6% over the second quarter, approximately 14% more than the rest of the companies in the S&P 500 Index.

Bonds: Extreme volatility was not contained to the stock markets. Following the April 2 tariff announcements, 10-year Treasury yields experienced their largest weekly rise in a quarter of a century, while the U.S. dollar steadily eroded, marking its worst start to a year since 1973. Moody’s Corporation downgraded the U.S. government’s credit rating to Aa1 during second quarter, and bond markets increasingly focused on the path of the U.S. fiscal deficit and the outlook for the U.S. dollar. Benchmark 10-year bond yields ended the period essentially unchanged, though the yield curve steepened, with 30-year bond yields rising approximately 0.20%. Investment grade corporate bond spreads were also largely unchanged over the quarter, reflecting strong fundamental and technical factors that provided support to this market. The Bloomberg U.S. Aggregate Bond Index rose 1.21% over the quarter.

For more on the economy and our outlook for the markets, see: Thrivent 2025 Midyear Market Outlook, by Chief Investment Strategist Steve Lowe

The quarter’s key economic data

First-quarter GDP, initially estimated to contract by 0.3% in April, was revised downward to a 0.5% contraction in late June. A surge in imports as consumers and companies attempted to buy goods ahead of anticipated tariffs weighed on the results.

Bar chart illustrating the quarterly percentage change in Real GDP from Q2 2022 to Q1 2025.

The consumer: Fading confidence and consumption

The Conference Board’s Consumer Confidence Index (CCI) declined in June, reversing a stronger-than-expected gain in May and following a succession of declines in other confidence measures reported across the quarter. Tariffs and their potential impact remain the primary explanation for the decline. While confidence measures do not always lead to a reduction in consumption, retail sales were generally weak over the quarter. April retail sales growth was initially reported at 0.1% month over month but was revised down to -0.1%, while May retail sales fell 0.9%, below expectations for a decline closer to 0.6%.

Employment: Jobs data stayed robust

The unemployment rate fell to 4.1% in June, well below expectations for a rise to 4.3%. However, the data was influenced by a significant decrease in the labor force participation rate (which includes people working and those looking for work), which dropped to 62.3%, its lowest level since 2022. New jobs created in June were above expectations at 147,000, but private payrolls rose only 74,000. Together with the upward revisions to the April and May data, three-month average job growth was 150,000. June’s average hourly earnings increased 0.2% relative to May and up 3.7% from last June, lower than consensus expectations.

Inflation: Higher, as expected

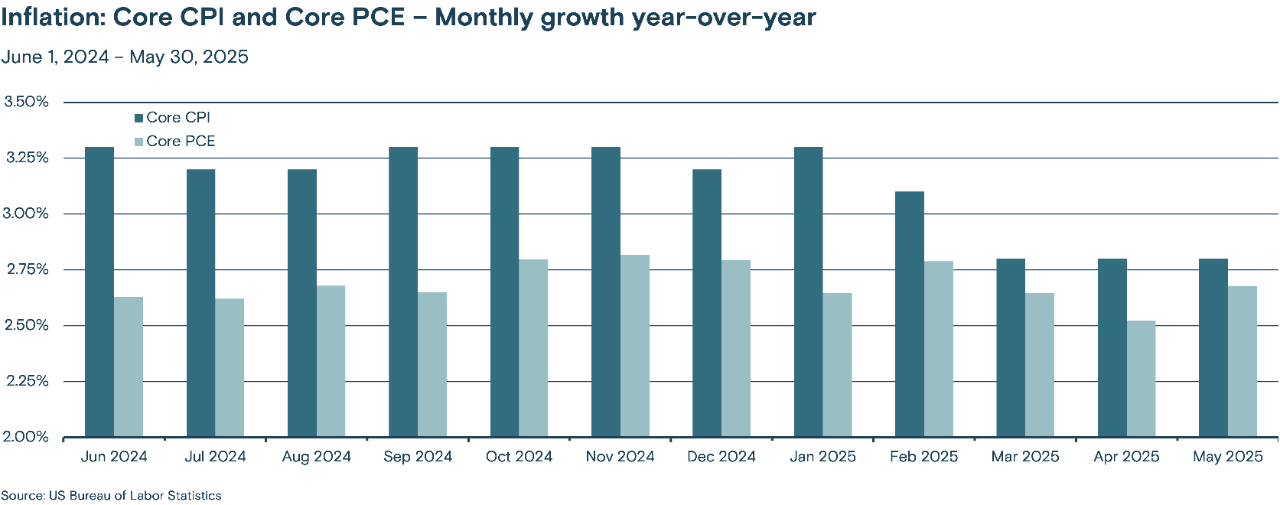
The Core Consumer Price Index (CPI) was stable over the quarter, with each month’s data release largely in line with expectations. However, the Core Personal Consumption Expenditures (PCE) Price Index, the U.S. Federal Reserve’s (Fed) preferred inflation measure, moved higher in May. At 2.7% higher relative to May of last year and 0.2% higher relative to April of this year, both figures were only marginally above expectations, which anticipated some price increases as a result of new tariffs. Nevertheless, the figures remain above the Fed’s target rate, which is a long-term average of near 2%—a level not seen since early 2021.

Line graph showing the year-over-year monthly growth of Core CPI (Consumer Price Index) and Core PCE (Personal Consumption Expenditures) from June 2024 to May 2025.

RELATED ARTICLES

The stock market historically rises after market lows

While you may be tempted to pull money out of the stock market to avoid corrections and bear markets, timing the market is notoriously difficult.

Investing in volatile times

Is market volatility making you want to overhaul your investment strategy?

How key markets responded

U.S. stocks rebounded

The benchmark S&P 500 Index rebounded from its April lows to set new highs late in the quarter. The index rose 10.94% during the period, lifting its year-to-date gain into positive territory at 6.20%. The information technology and communication services sectors led the rebound as enthusiasm for some of the largest companies in these sectors were supported by a more optimistic outlook for the U.S. economy. The energy sector was particularly weak over the period, falling 8.56%, largely due to the decline in oil prices. The benchmark Russell 2000 Index of small-cap stocks rose 8.11% over the period, while the technology-heavy NASDAQ Composite Index surged 17.75%.

Line graph showing the trend of the S&P 500 Index from July 2024 to June 30, 2025.

The table below shows the past month, quarter and year-to-date performance results of the 11 sectors:

Table showing the S&P 500 sector returns for June, Q2 and the year-to-date (YTD) returns for 2025.

Corporate earnings projections rose

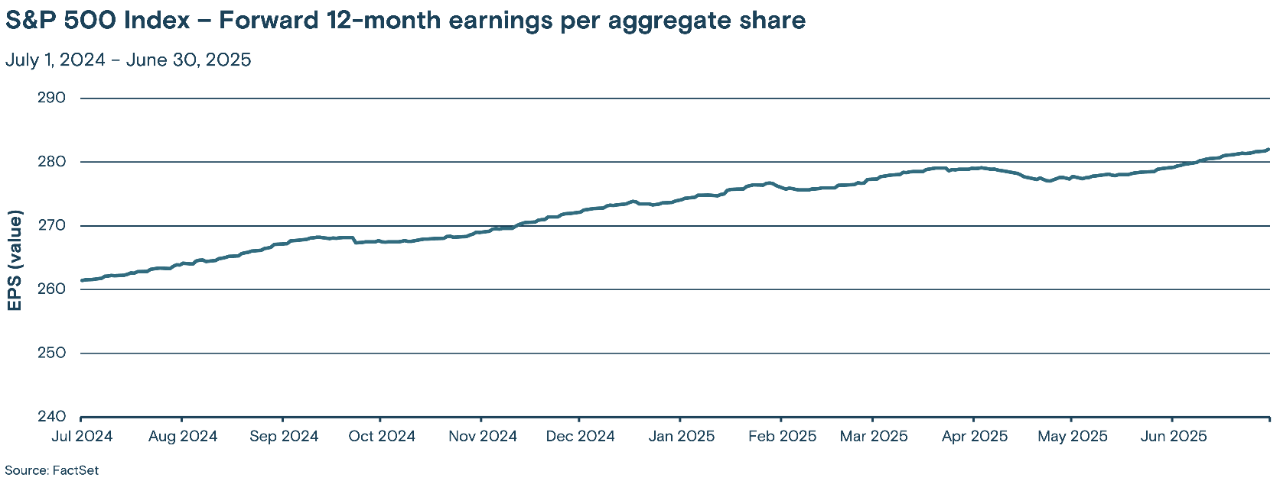
Corporate 12-month earnings projections for the S&P 500 Index dipped in April but ended the period higher, rising 1.07%, extending their steady climb higher over the past year.

Line graph showing the trend of the S&P 500 Index's forward 12-month earnings per aggregate share (EPS) from July 2024 to June 30, 2025.

Forward P/E ratios rebounded

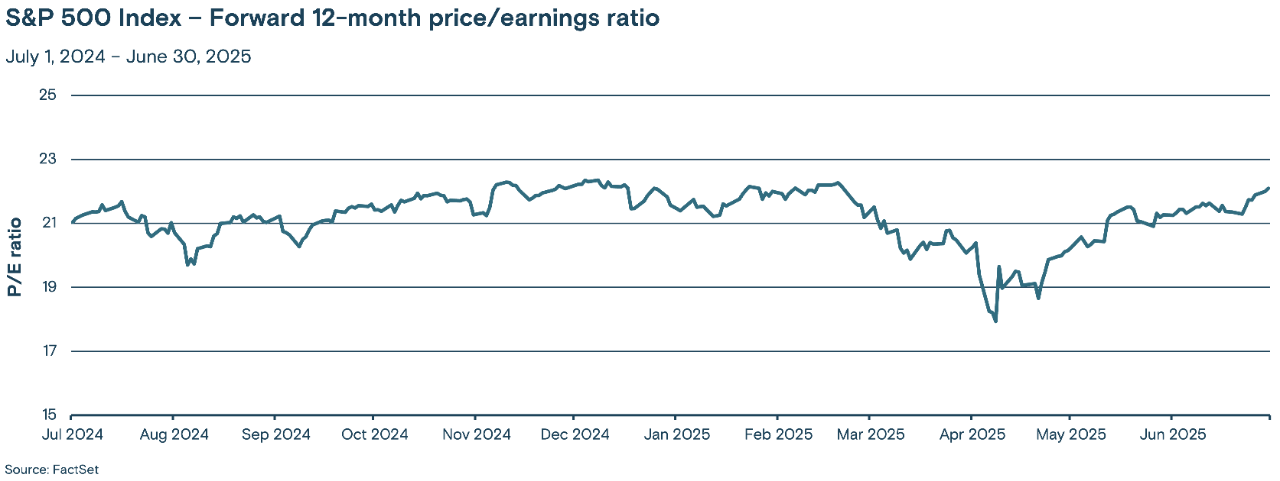
The forward 12-month price-earnings ratio (P/E) of the S&P 500 Index rebounded 9.49% over the second quarter, from 20.18 at the end of March to 22.09 at the end of June. A higher P/E ratio means stock valuations are higher relative to their earnings per aggregate share.

Line graph showing the trend of the S&P 500 Index's forward 12-month price/earnings (P/E) ratio from July 2024 to June 30, 2025.

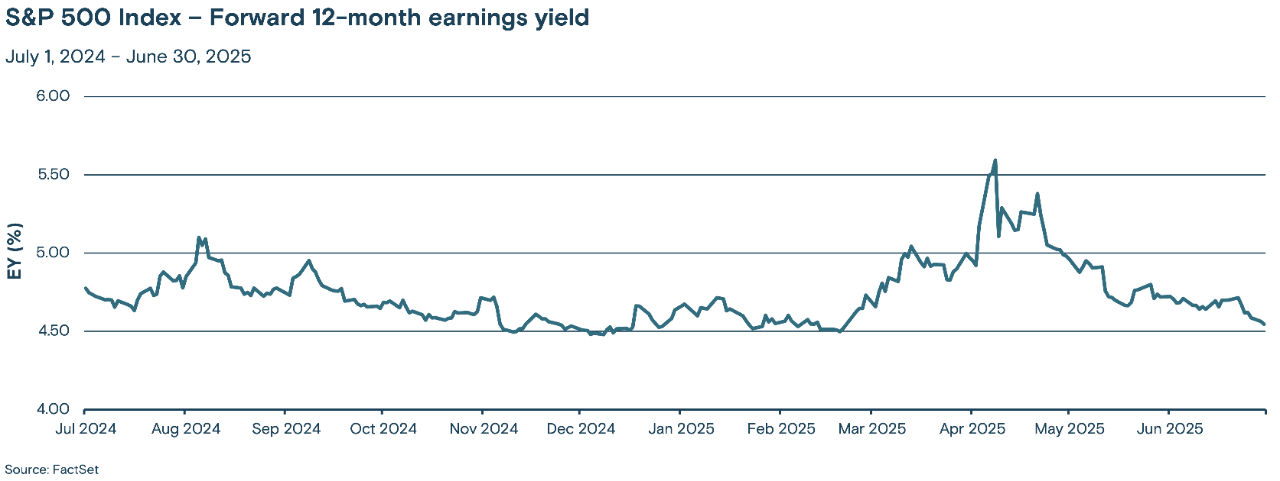
The forward 12-month earnings yield, which is the inverse of P/E, fell over the quarter. The 12-month forward earnings yield can be helpful in comparing equity earnings yields with current bond yields. At 4.54%, the forward 12-month earnings yield ended the quarter well above the 4.23% yield offered by 10-year U.S. Treasuries.

Line graph showing the trend of the S&P 500 Index's forward 12-month earnings yield from July 2024 to June 30, 2025.

International equities: Marginally outperformed the U.S.

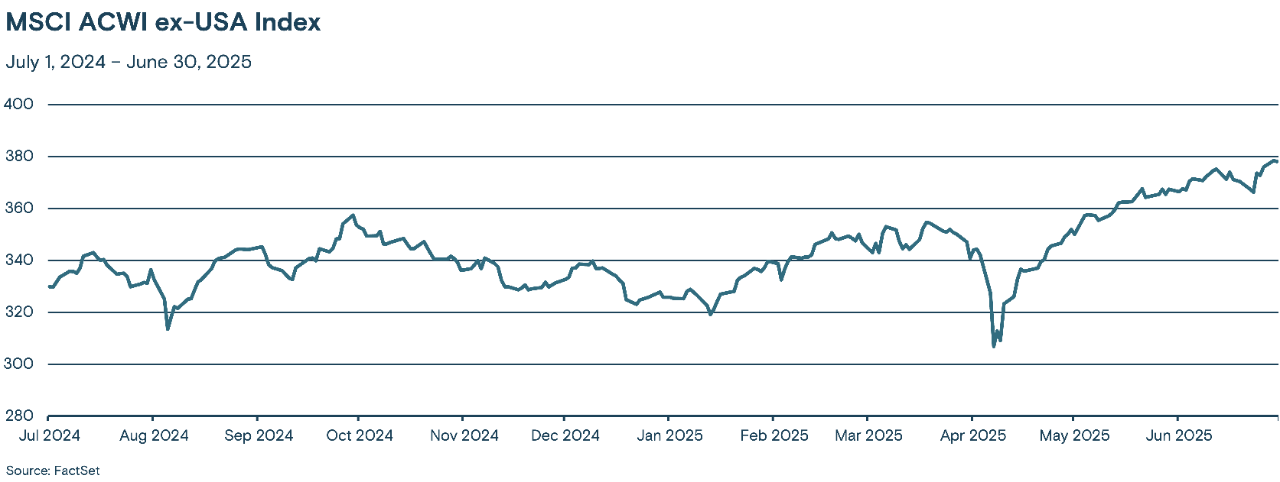
The MSCI ACWI ex-USA Index®, which tracks stocks across developed and emerging-market economies across the world (excluding the U.S.) rose 10.95% over the quarter, slightly outperforming the S&P 500 Index which gained 10.57%. This performance was primarily driven by U.S. dollar weakness, as equity index returns in domestic currencies of Europe were significantly lower. Stocks in Asia performed relatively better, supported by the easing of trade tensions late in the quarter. 

Line graph showing the trend of the MSCI ACWI ex-USA Index from July 2024 to June 2025.

Treasury bonds: Sensitive to fiscal concerns and the U.S. dollar

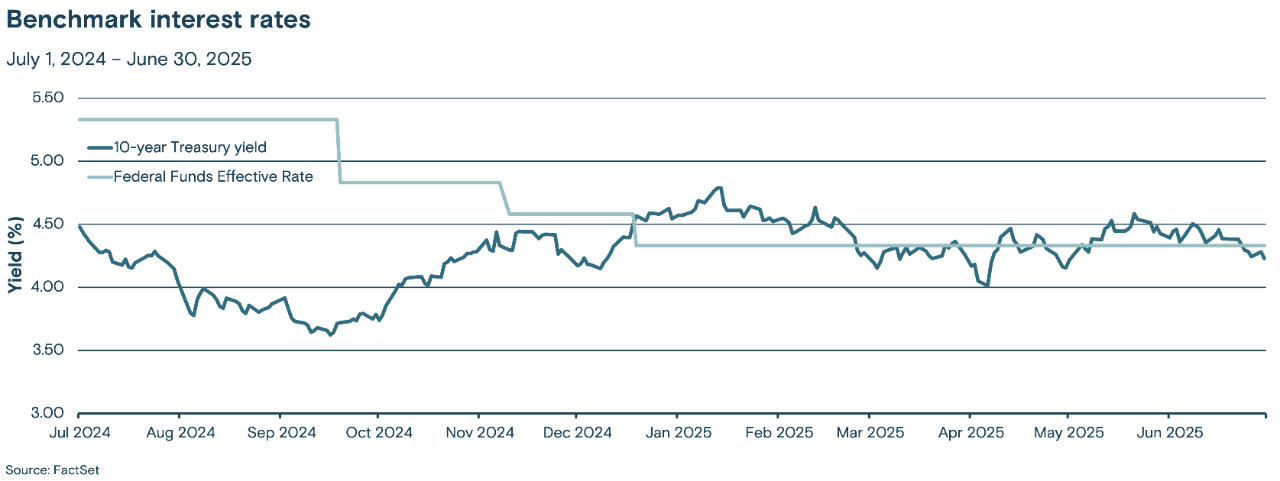
Benchmark 10-year Treasury bond yields ended the quarter at 4.23%, largely unchanged from their 4.21% yield at the end of March. However, the yield curve steepened over the period, with the longer-dated 30-year bond yield rising approximately 0.20% on concerns about the outlook for the U.S. fiscal deficit and a weaker U.S. dollar weighing on foreign investors’ appetite for funding the U.S. government.

Line graph showing the trend of the 10-year Treasury yield and the Federal Funds Effective Rate from July 2024 to June 2025.

Credit markets: Stayed resilient

Corporate bond spreads widened in April amid broad market volatility resulting from the early-April tariff announcements but ended the quarter with marginally tighter yield spreads and positive total returns. Corporate bonds were supported by their relatively high yields, robust fundamentals and lower levels of new issuance over the period. The Bloomberg U.S. Aggregate Bond Index rose 1.21% over the quarter, bringing its year-to-date gain to 4.02%.

The U.S. dollar: Trending lower

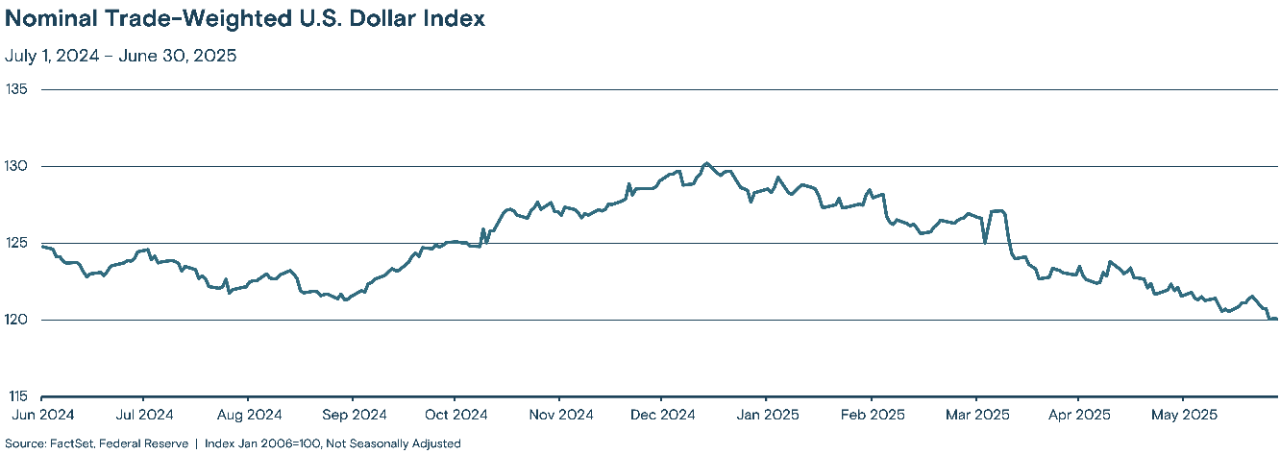
The Nominal Trade-Weighted U.S. Dollar Index fell 5.41% in the second quarter, bringing its year-to-date decline to -7.27%—its weakest start to a year since 1973. The decline was predominantly driven by uncertainty over trade policy, the U.S. economic outlook as well as concerns about domestic fiscal policy. Strength in the euro and Japanese yen also contributed to the U.S. dollar’s relative weakness, with the euro supported by a more stimulative fiscal policy and the yen continuing to strengthen on expectations of rising interest rates in Japan.

Line graph showing the trend of the Nominal Trade-Weighted U.S. Dollar Index from July 2024 to June 30, 2025.

Commodities: Weakness, led by oil

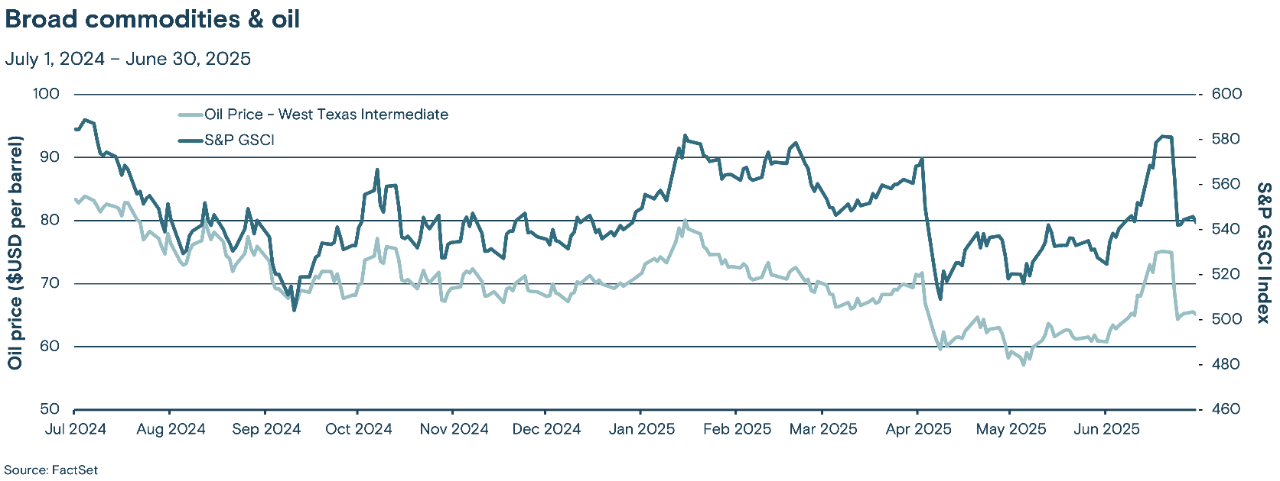
The S&P GSCI Index (a broad-based and production-weighted index representing the global commodity market) fell 4.39% in the second quarter, led by a decline in the price of oil. Industrial and precious metals rose over the period, largely as a result of tariff uncertainty. Oil prices briefly surged late in the quarter on escalating conflict in the Middle East, but the announcement of increased supply from OPEC+ (a consortium of oil-producing nations) weighed on prices. The cost of a barrel of West Texas Intermediate (a grade of crude oil used as a benchmark in oil pricing) fell to $65.11, a drop of 8.91% from the end of the first quarter.

Line graph comparing the price of West Texas Intermediate (WTI) oil and the S&P GSCI index from July 2024 to June 2025.

Before making a change in your investment portfolio, you may wish to consult with a financial professional to determine how that may align with your long-term goals and objectives.


Media contact
: Callie Briese, 612-844-7340callie.briese@thrivent.com

All information and representations herein are as of 07/15/2025, unless otherwise noted.

The views expressed are as of the date given, may change as market or other conditions change, and may differ from views expressed by other Thrivent Asset Management, LLC associates. Actual investment decisions made by Thrivent Asset Management, LLC will not necessarily reflect the views expressed. This information should not be considered investment advice or a recommendation of any particular security, strategy or product. Investment decisions should always be made based on an investor's specific financial needs, objectives, goals, time horizon, and risk tolerance.

The forward PE ratio uses the forecasted earnings per share of the company over the next 12 months for calculating the price-earnings ratio. It is calculated by dividing the price per share by forecasted earnings per share over the next 12 months.

Earnings yield is the 12-month earnings divided by the share price. Earnings yield is the inverse of the P/E ratio. Earnings yield is one indication of value; a low ratio may indicate an overvalued stock, or a high value may indicate an undervalued stock.

The S&P 500® Index is a market-cap weighted index that represents the average performance of a group of 500 large-capitalization stocks.

The CBOE Volatility Index, or VIX, is a real-time market index representing the market’s expectations for volatility over the coming 30 days. Investors use the VIX to measure the level of risk, fear or stress in the market when making investment decisions.

The Russell 2000® Index is an unmanaged index considered representative of small-cap stocks.

The Nasdaq Composite Index is a stock market index that includes almost all stocks listed on the Nasdaq stock exchange. The Nasdaq – National Association of Securities Dealers Automated Quotations – is an electronic stock exchange with more than 3,300 company listings.

The MSCI ACWI ex-USA Index is an unmanaged index considered representative of large- and mid-cap stocks across developed and emerging markets, excluding the U.S.

The Bloomberg U.S. Aggregate Bond Index is an unmanaged index considered representative of the U.S. investment-grade, fixed-rate bond market.

The Federal Funds effective rate is the interest rate at which depository institutions (mainly banks) lend reserve balances to other depository institutions overnight on an uncollateralized basis. In simpler terms, it's the rate banks charge each other for short-term loans to meet their reserve requirements.

The Consumer Confidence Index (CCI) is a survey administered by the Conference Board. The CCI measures what consumers are feeling about their expected financial situation, whether that's optimistic or pessimistic.

The Consumer Price Index measures the monthly change in prices paid by U.S. consumers for a basket of goods and services.

The Core Consumer Price Index (CPI) measures changes in the prices of goods and services, with the exclusion of food and energy.

The Personal Consumption Expenditures (PCE) Price Index, also known as consumer spending, is a measure of the spending on goods and services by people of the U.S.

The Core Personal Consumption Expenditures (PCE) Price Index, also known as consumer spending, is a measure of the spending on goods and services, excluding food and energy prices, by people of the U.S.

The Nominal Trade-weighted U.S. Dollar Index measures the value of the U.S. dollar based on its competitiveness versus trading partners.

The Institute for Supply Management (ISM) survey is a monthly indicator of U.S. economic activity based on a survey of purchasing managers at manufacturing firms nationwide.

Any indexes shown are unmanaged and do not reflect the typical costs of investing. Investors cannot invest directly in an index.

Past performance is not necessarily indicative of future results.