
Steps to start planning for retirement now
Use these tips to start planning for the retirement you want, or can afford.
11/11/2025
3rd QUARTER 2025 MARKET REVIEW
10/07/2025
Thrivent Asset Management contributors to this report: John Groton, Jr., CFA, director of administration and materials & energy research; Matthew Finn, CFA, head of equity mutual funds; Kent White, CFA, head of fixed income mutual funds; and Charles Hofstrom, CFA, senior product specialist
Stocks continued achieving new highs while bond yields fell modestly.
Annual inflation is still above the Fed’s core target of 2%.
Company earnings were stronger than expected.
The economy: The U.S. economy was stronger than most forecasters expected despite high levels of policy uncertainty, particularly around international trade. Consumer spending—which drives about two thirds of the U.S. economy—stayed robust, unemployment rates stayed near historical lows and there has been substantial investment related to artificial intelligence (AI). However, employment data released over the period suggests the labor market has been weakening faster than expected.
Stocks: The benchmark S&P 500® Index continued to set record highs as the quarter progressed, ending the period up 7.79%, for a year-to-date gain of 13.72%. Concerns about the labor market gave way to increasing optimism about corporate earnings after second-quarter earnings largely beat expectations, and growing expectations for interest-rate cuts from the U.S. Federal Reserve (Fed). The Russell 2000 Index rose 12.02% over the quarter as the outlook for small-cap stocks was boosted by improving earnings and the prospect of lower interest rates (given these companies’ higher sensitivity to borrowing costs).
Bonds: The Bloomberg U.S. Aggregate Bond Index rose 2.03% over the quarter. Benchmark 10-year Treasury yields fell modestly, and investment-grade corporate bonds spreads remained tight. Shorter-dated 2-year Treasury yields pushed lower over the period as expectations grew that the Fed would soon return to easing monetary policy. At its September meeting, amid indications the economy had softened and inflation increases were moderating, the Fed cut its policy rate by 0.25% while signaling two more cuts were likely to take place in the remainder of 2025.
For more on the economy and our outlook for the markets, see: Strong markets, weakening fundamentals, by Chief Investment Strategist Steve Lowe
U.S. economic data released over the quarter was generally stronger than most forecasters expected. Second-quarter gross domestic product (GDP) rose at a revised annual rate of 3.3%, above initial consensus expectations near 2.6%, supported by an increase in consumer spending and a decrease in imports. However, not all data was positive, with the Institute for Supply Management’s (ISM) Manufacturing Index released in early October moving back to levels indicating a contraction in manufacturing, and employment data weakened faster than expected.
Consumers, in aggregate, showed little sign of reduced spending over the third quarter, bolstered by income gains above inflation. But the aggregate data is skewed by consistently stronger spending from the higher-income tiers, which account for around half of all consumer spending. Generally, the lower income tiers have shown more apprehension about their future finances, citing higher prices as a major concern. Nevertheless, retail sales rose each month over the period, with August’s data exceeding expectations, despite some evidence that tariffs are increasing goods prices.
Employment data released over the quarter, including the latest annual revisions in jobs created, indicated employment has been weaker than expected and weaker for longer than the market had assumed. Jobs growth slowed to just 22,000 new jobs added in August, well below expectations and the second consecutive weak report. Private payroll growth, excluding the distorting effects during the COVID-19 pandemic, fell to near 15-year lows. Continuing claims (unemployment claims extended beyond one week) are still low but rose over the period, and longer-term unemployment reached levels often associated with a recession.
Inflation rose over the period, but the impact of tariffs on prices was generally more modest than expected. The headline Consumer Price Index (CPI) rose 0.4% in August, the biggest monthly gain since January, putting the annual inflation rate at 2.9%. The Core Personal Consumption Expenditures (PCE) Price Index, the Fed’s preferred inflation measure, rose 2.9% in August, below consensus expectations for a 3.0% rise. Nevertheless, the figures remain above the Fed’s target rate, which is a long-term average of near 2%—a level not seen since early 2021.
The benchmark S&P 500 Index rose 7.79% during the third quarter, setting new all-time highs and lifting its year-to-date return to 13.72%. The benchmark Russell 2000 Index of small-cap stocks surged 12.02% and the technology-heavy NASDAQ Composite Index® rose 11.24% over the period. Stocks were supported by second-quarter earnings generally exceeding expectations, future earnings estimates rising at their fastest pace in nearly four years and the likelihood that lower interest rates would further fuel economic growth. The Russell 2000 Index particularly benefited from growing expectations that the Fed will be lowering interest rates, given the generally higher debt burdens of smaller companies. Performance in the S&P 500 Index was broad based, with all sectors except consumer staples rising over the period.
The table below shows the past month, quarter and year-to-date performance results of the 11 sectors:
Corporate 12-month earnings projections for the S&P 500 Index extended their steady climb higher, rising 4.49% over the quarter, supported by strong second-quarter earnings and positive revisions to expected earnings.
The forward 12-month price-earnings ratio (P/E) of the S&P 500 Index rose 3.05% over the quarter, from 22.09 at the end of June to 22.77 at the end of September. A higher P/E ratio means stock valuations are higher relative to their earnings per aggregate share.
The forward 12-month earnings yield, which is the inverse of P/E, declined 0.13% over the quarter. This aggregate yield can be helpful in comparing equity earnings yields with current bond yields. At 4.41%, the forward 12-month earnings yield ended the quarter above the 4.15% yield offered by 10-year U.S. Treasuries, but the gap has been steadily narrowing.
The MSCI ACWI ex-USA Index®, which tracks stocks across developed and emerging-market economies across the world (excluding the U.S.) rose 6.35% over the quarter, underperforming the S&P 500 Index. Stocks in Asia were particularly strong over the quarter, supported by a rally in Chinese technology stocks and positive performance in Japan where agreement on a U.S.-Japan trade deal helped boost returns. Europe’s performance was weighed down by more moderate gains in Germany, the U.K. and France, where the country’s political uncertainty dampened investor appetite for stocks.
Benchmark 10-year Treasury bond yields ended the quarter at 4.15%, 0.08% lower than their 4.23% yield at the end of June. Nevertheless, the yield curve steepened as shorter-dated 2-year Treasury yields pushed lower over the quarter on increased expectations the Fed would soon begin easing monetary policy. At its September meeting, signs of a softer economy and moderate increases in inflation allowed the Fed to cut its policy rate by 0.25% while signaling two more cuts were likely in 2025.
Investment-grade and high-yield corporate bonds were supported by strong second-quarter earnings reports, growing expectations for interest-rate cuts and continued demand for yield. Investment-grade yield spreads are now near their lowest levels in over 25 years, and high-yield (non-investment grade) spreads are not far from their historical lows. Demand for these bonds comes from their generally strong credit fundamentals but also a broad-based demand for yield that extends across the fixed-income sectors. The Bloomberg U.S. Aggregate Bond Index rose 2.03% over the quarter, bringing its year-to-date rise to 6.13%.
The Nominal Trade-Weighted U.S. Dollar Index rose 0.86% in the third quarter, largely due to a reduction in tariff-related uncertainty and a broad-based improvement in investment sentiment, which lessened concerns over a large rotation away from the dollar by foreign investors. Also, the U.S. dollar benefited by a decline in market expectations for Fed interest rate cuts, as higher U.S. rates help support the dollar. While the Fed did cut interest rates during the quarter, the reduction was largely in line with expectations. Year-to-date through the third quarter, the trade-weighted U.S. dollar fell about 7%.
The S&P GSCI Index (a broad-based and production-weighted index representing the global commodity market) rose 1.26% in the third quarter, pushing the index’s year-to-date return into positive territory at 0.06%. Gold continued to set record highs on a combination of steady global demand, expectations for lower interest rates (which lowers the opportunity cost of owning non-yield-paying investments) and ongoing uncertainty about economic policy in the U.S. The cost of a barrel of West Texas Intermediate (a grade of crude oil used as a benchmark in oil pricing) fell to $62.37, a drop of 4.21% from the end of the first quarter, largely due to fears about excess supply of the commodity. Gasoline prices at the pump fell over the quarter, with the national average down 1.11% to $3.30 a gallon.
Before making a change in your investment portfolio, you may wish to consult with a financial professional to determine how that may align with your long-term goals and objectives.
All information and representations herein are as of 10/07/2025, unless otherwise noted.
The views expressed are as of the date given, may change as market or other conditions change, and may differ from views expressed by other Thrivent Asset Management, LLC associates. Actual investment decisions made by Thrivent Asset Management, LLC will not necessarily reflect the views expressed. This information should not be considered investment advice or a recommendation of any particular security, strategy or product. Investment decisions should always be made based on an investor's specific financial needs, objectives, goals, time horizon, and risk tolerance.
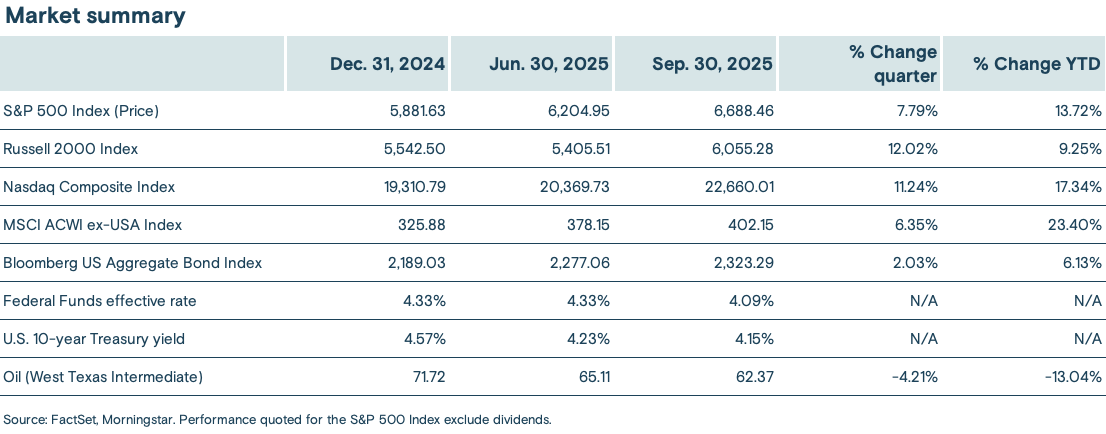
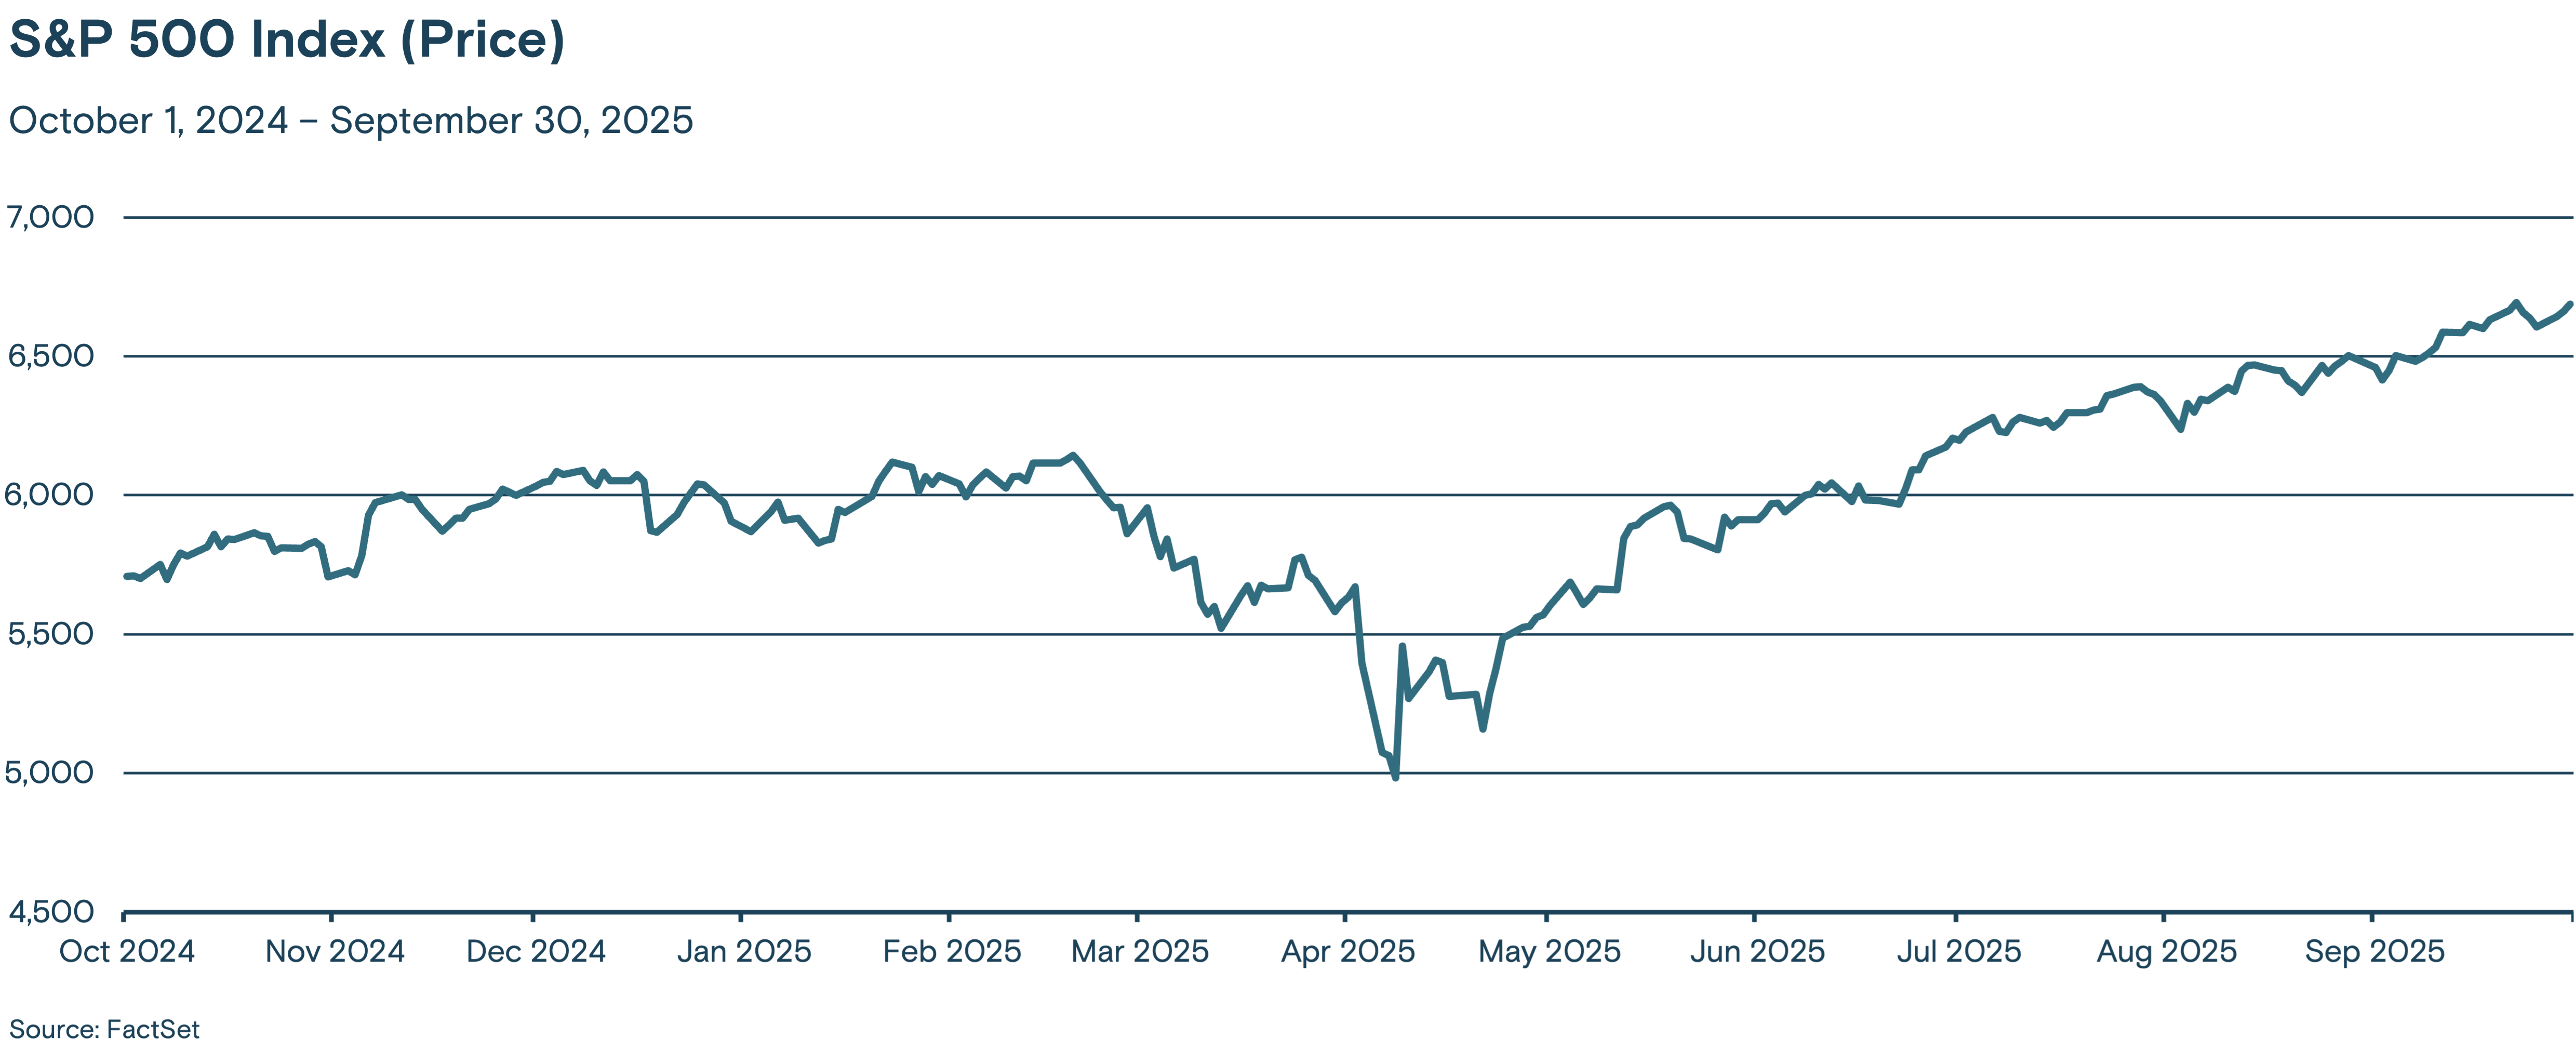
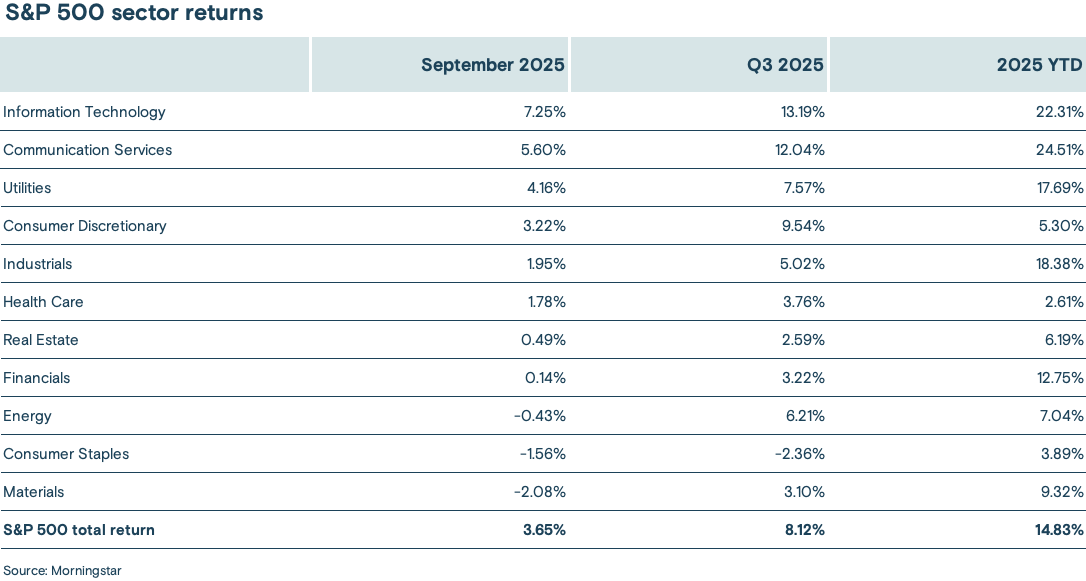
The S&P 500® Index is a market-cap weighted index that represents the average performance of a group of 500 large-capitalization stocks.
The Russell 2000® Index is an unmanaged index considered representative of small-cap stocks.
The Nasdaq Composite Index is a stock market index that includes almost all stocks listed on the Nasdaq stock exchange. The Nasdaq – National Association of Securities Dealers Automated Quotations – is an electronic stock exchange with more than 3,300 company listings.
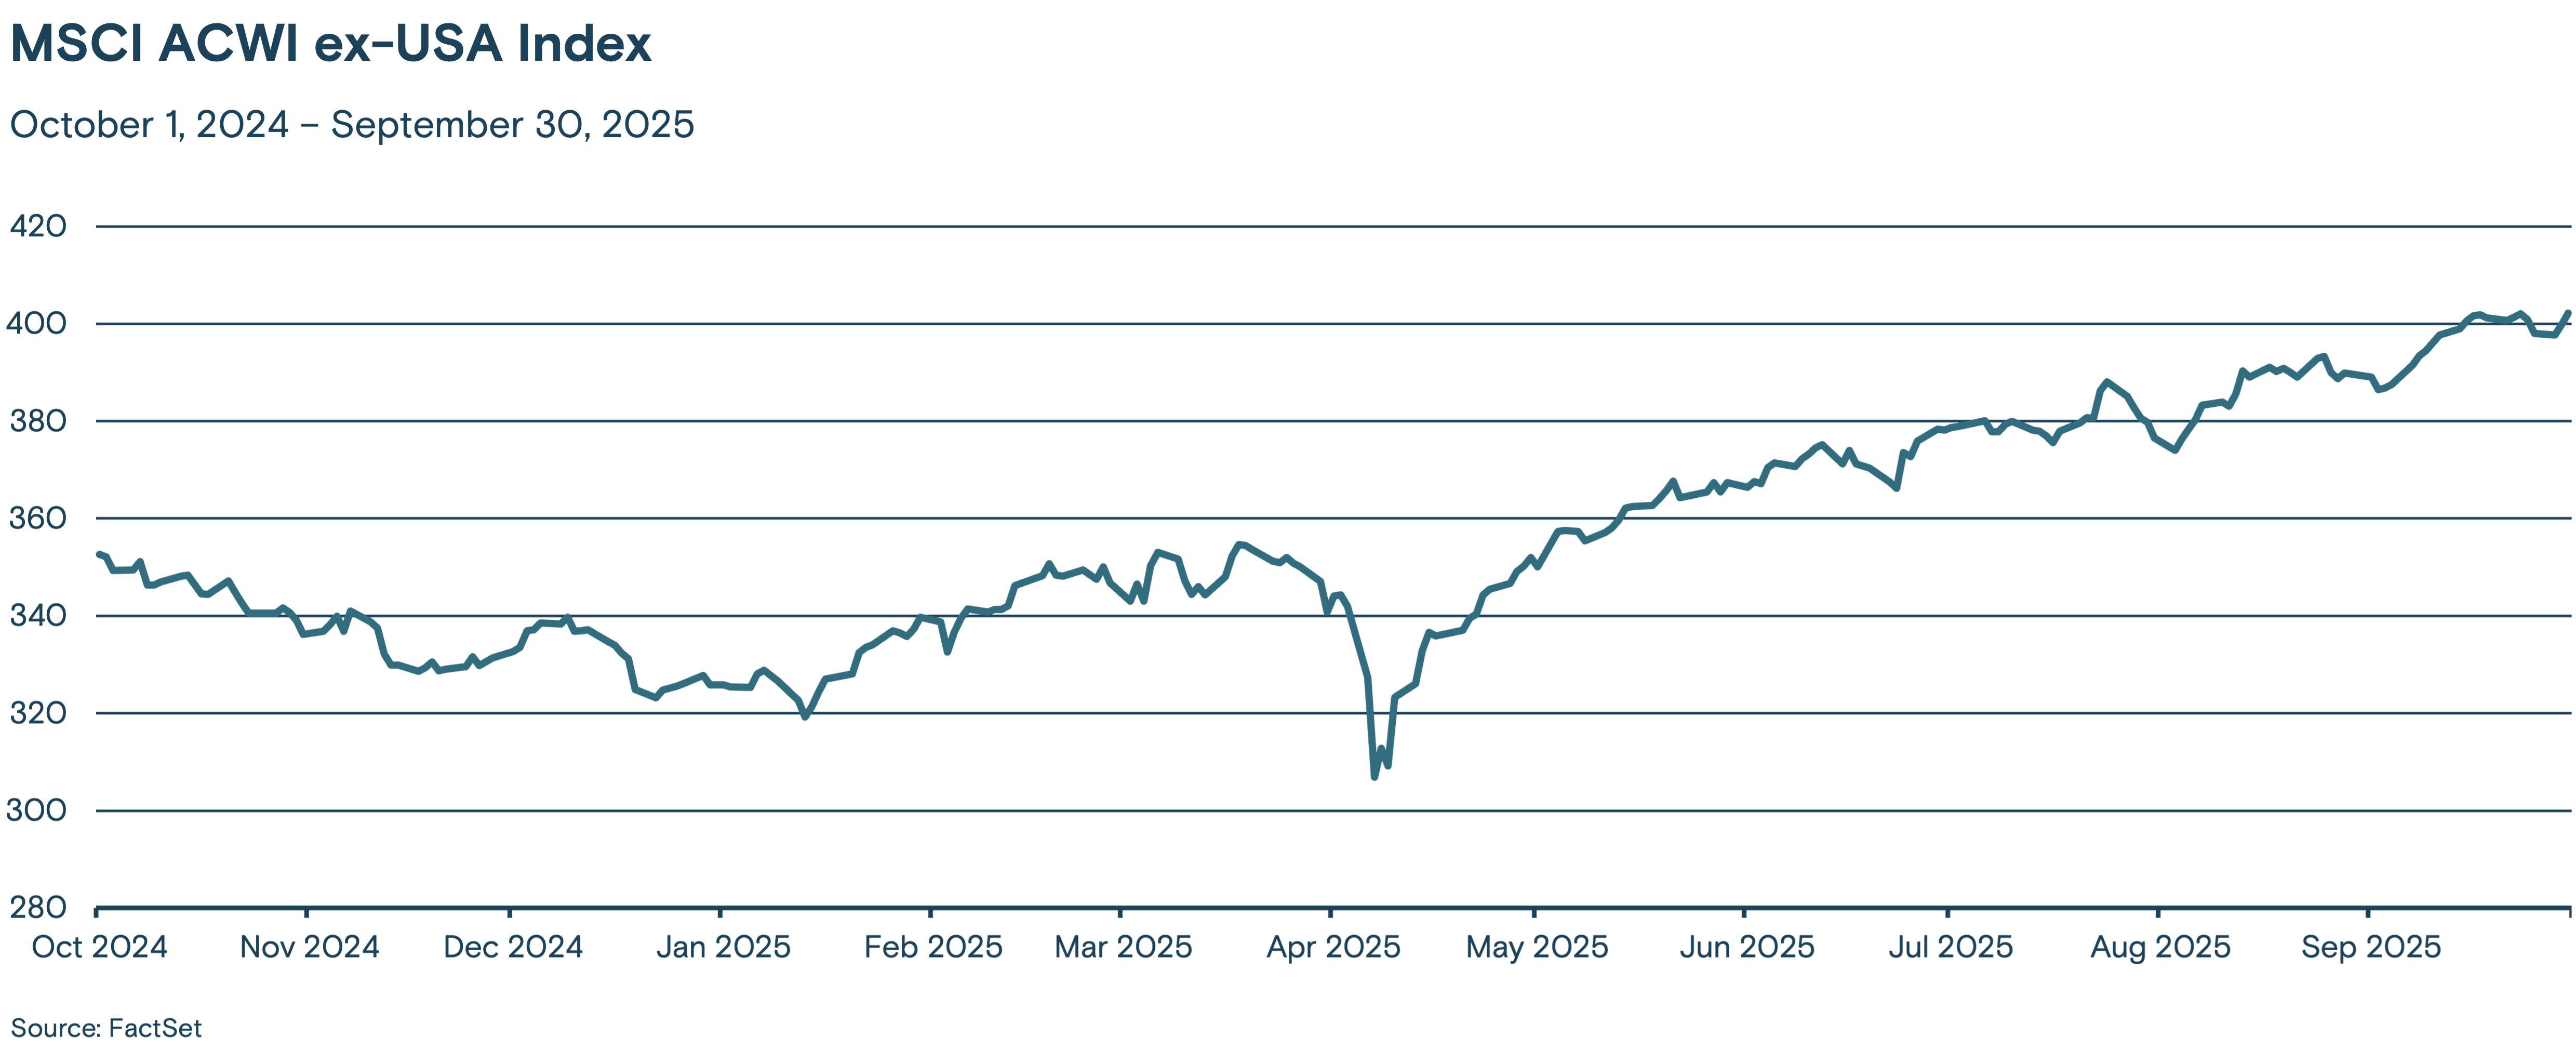
The MSCI ACWI ex-USA Index is an unmanaged index considered representative of large- and mid-cap stocks across developed and emerging markets, excluding the U.S.
The Bloomberg U.S. Aggregate Bond Index is an unmanaged index considered representative of the U.S. investment-grade, fixed-rate bond market.
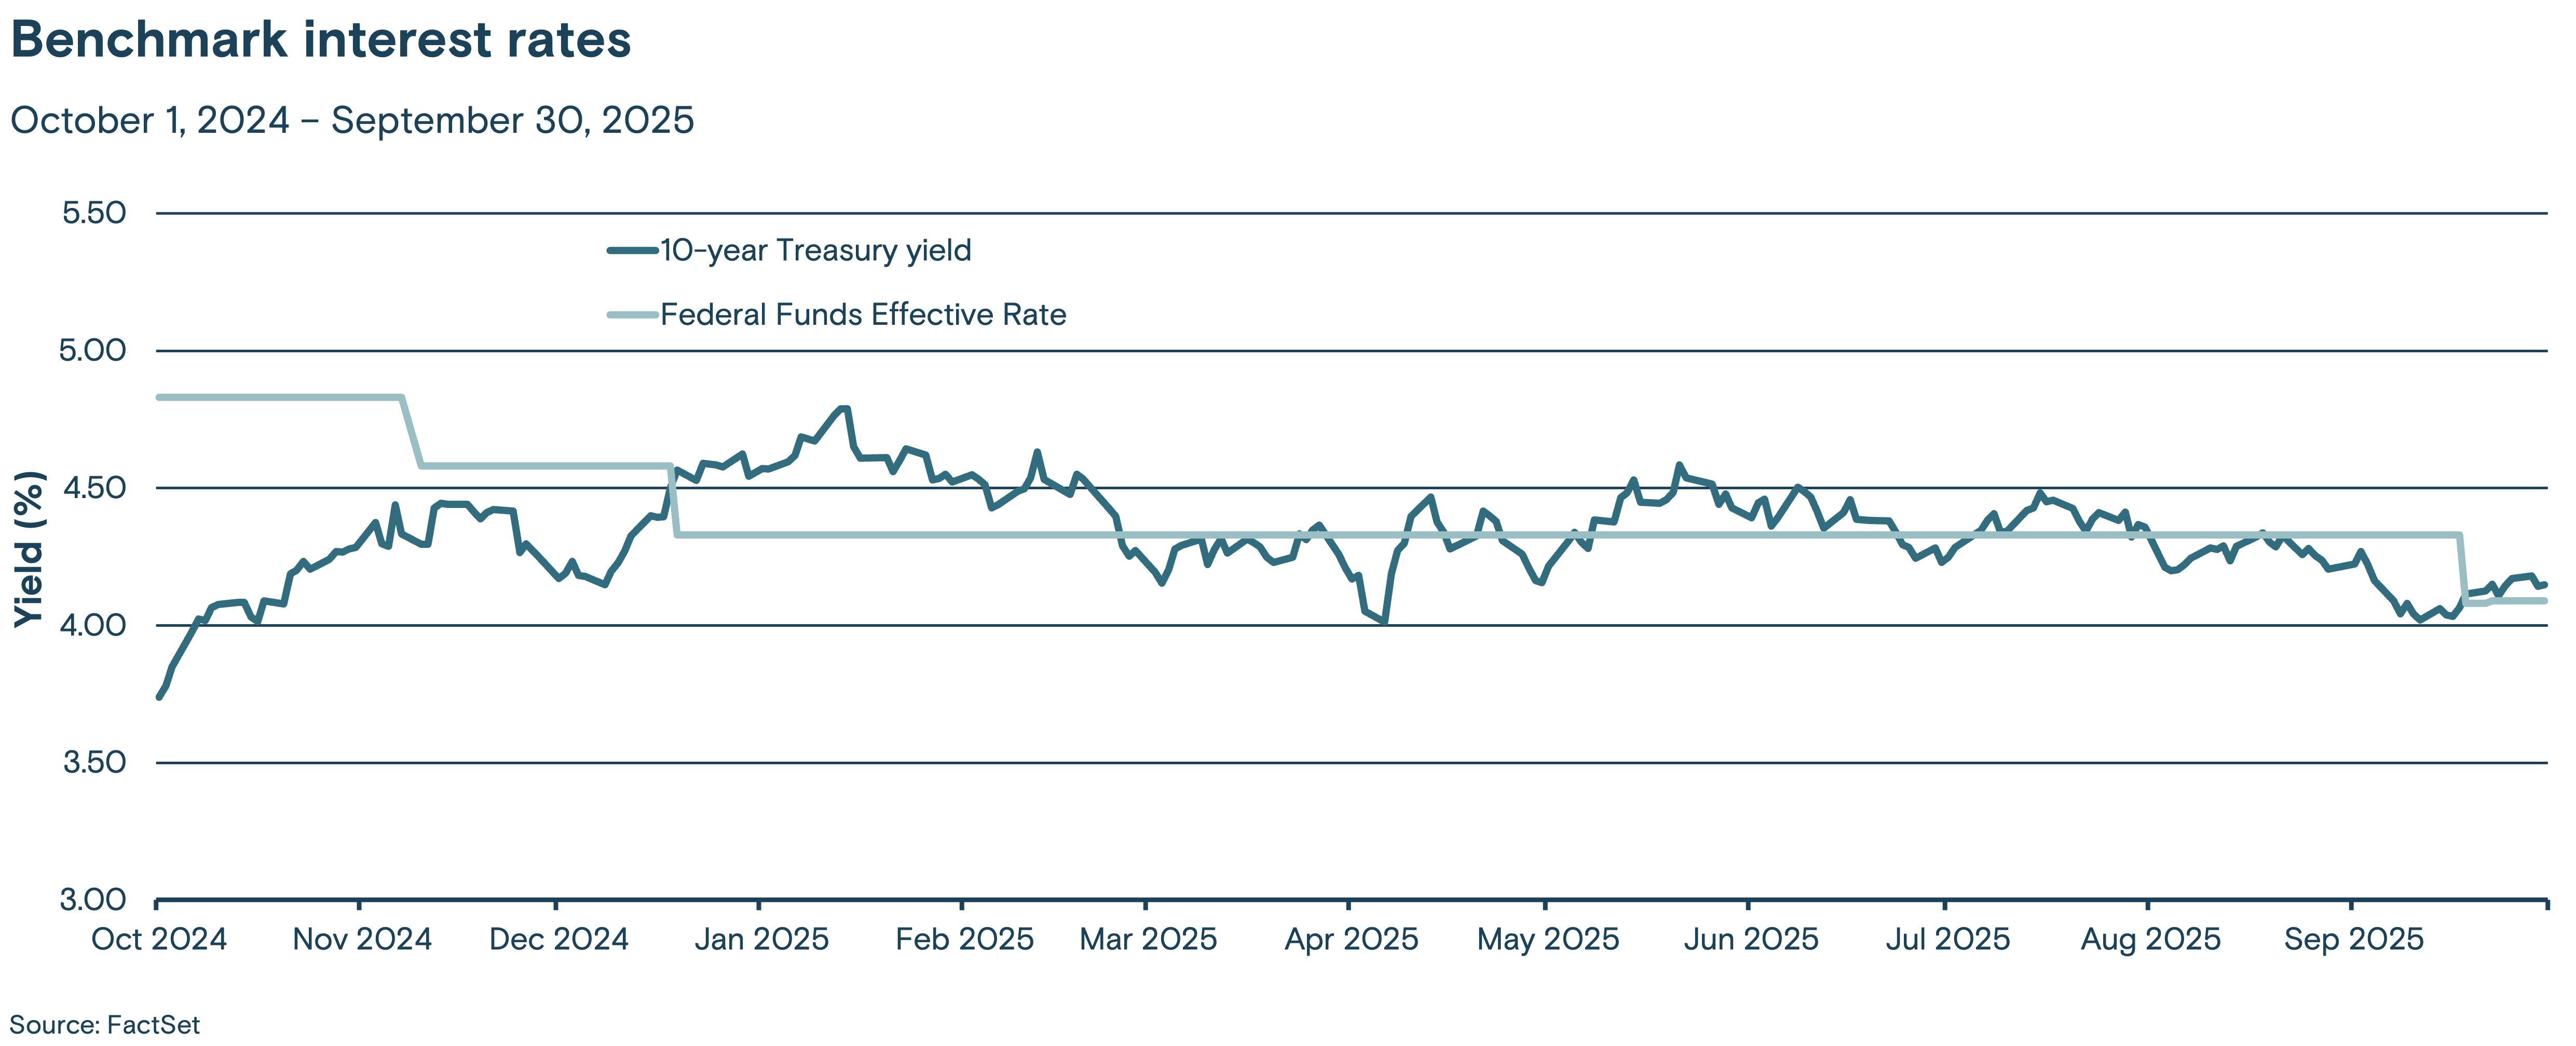
The Federal Funds effective rate is the interest rate at which depository institutions (mainly banks) lend reserve balances to other depository institutions overnight on an uncollateralized basis. In simpler terms, it's the rate banks charge each other for short-term loans to meet their reserve requirements.
The Institute for Supply Management (ISM) survey is a monthly indicator of U.S. economic activity based on a survey of purchasing managers at manufacturing firms nationwide.
The Consumer Price Index measures the monthly change in prices paid by U.S. consumers for a basket of goods and services.
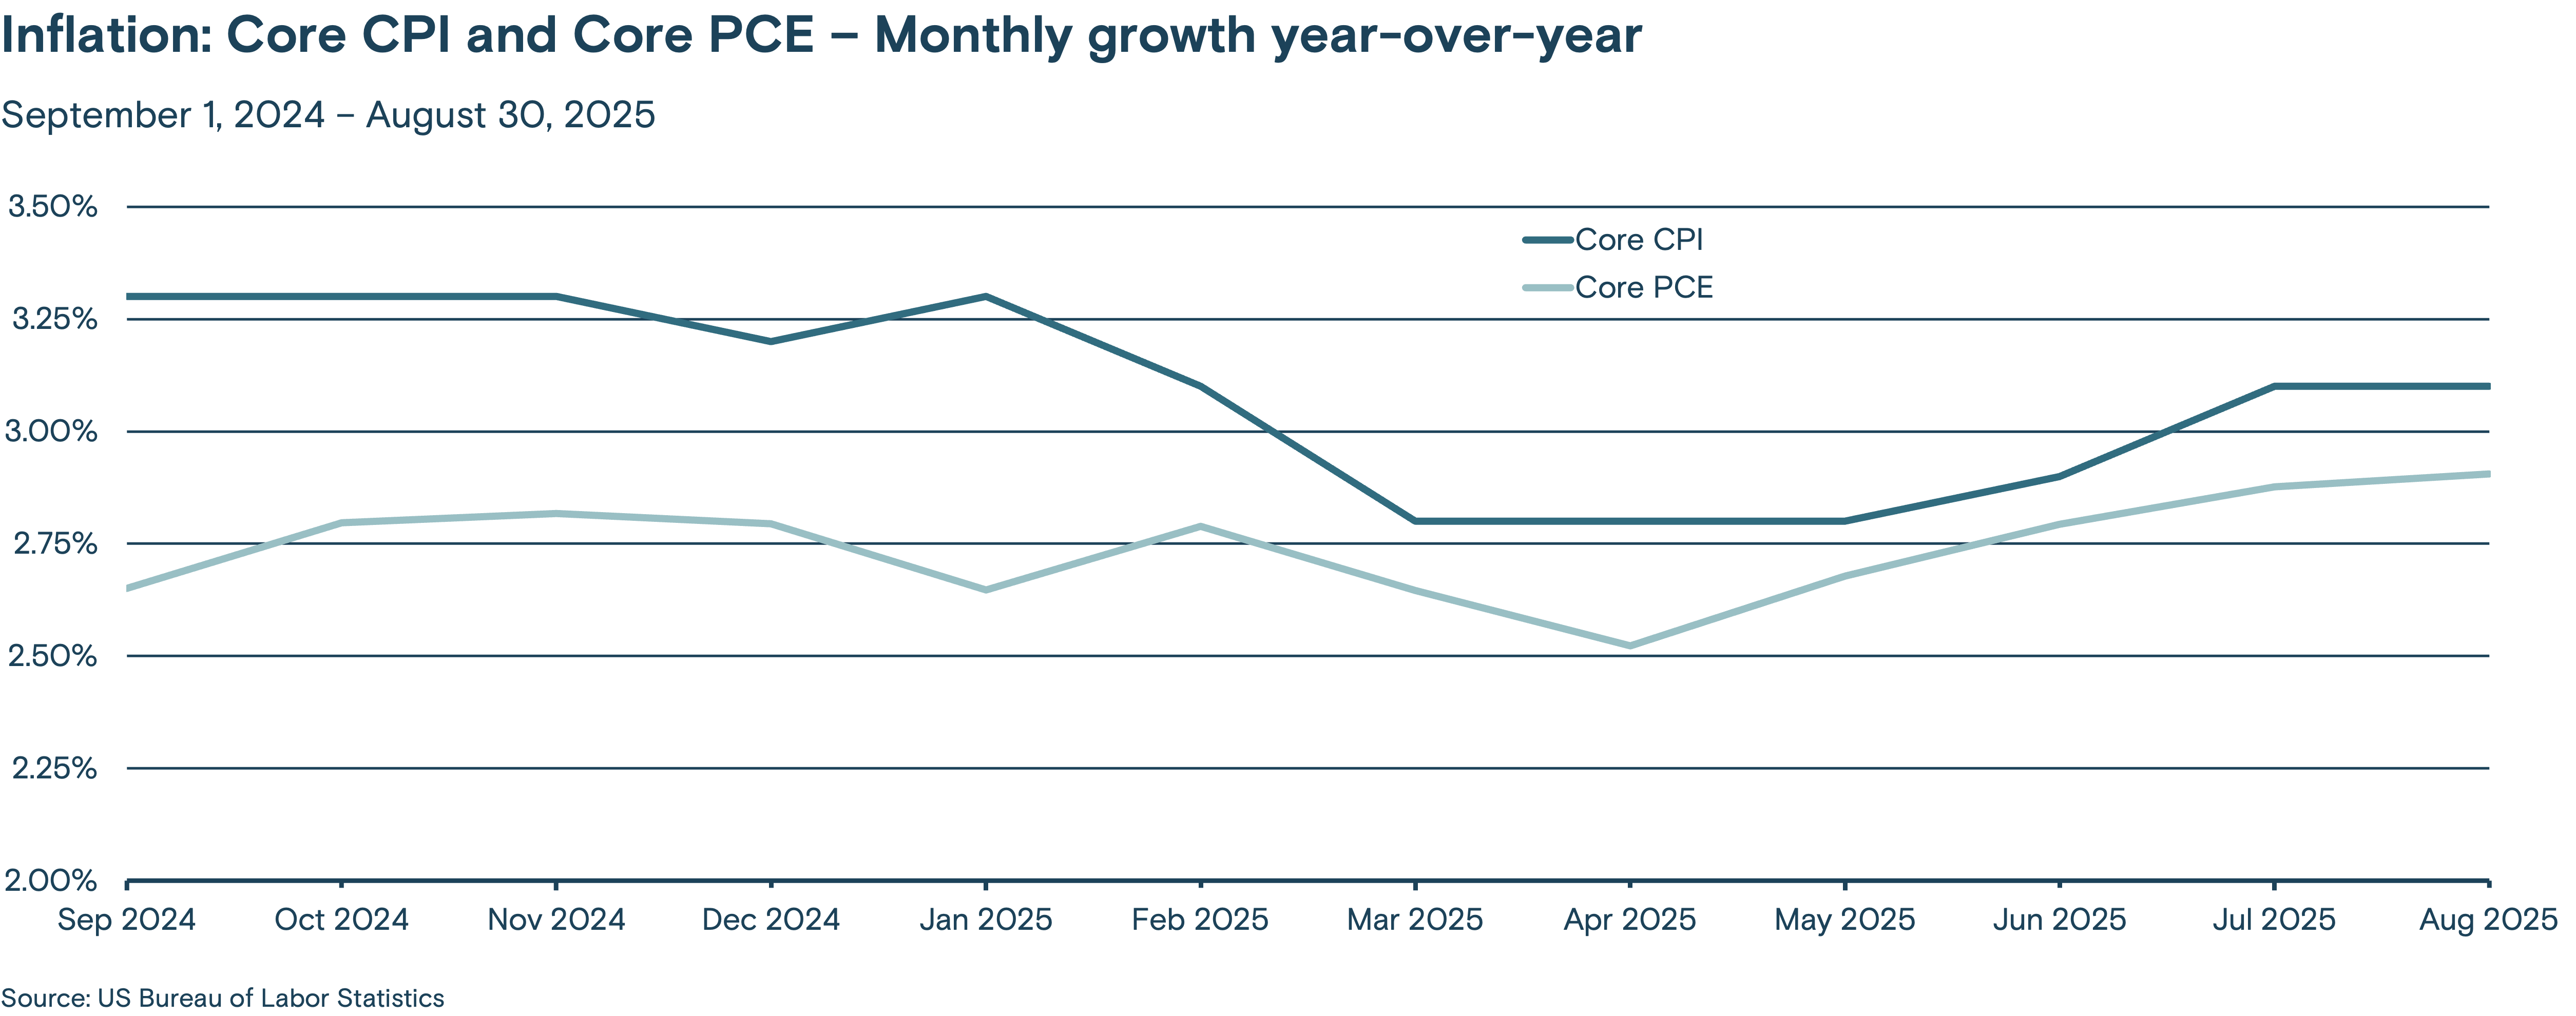
The Core Consumer Price Index (CPI) measures changes in the prices of goods and services, with the exclusion of food and energy.
The Core Personal Consumption Expenditures (PCE) Price Index, also known as consumer spending, is a measure of the spending on goods and services, excluding food and energy prices, by people of the U.S.
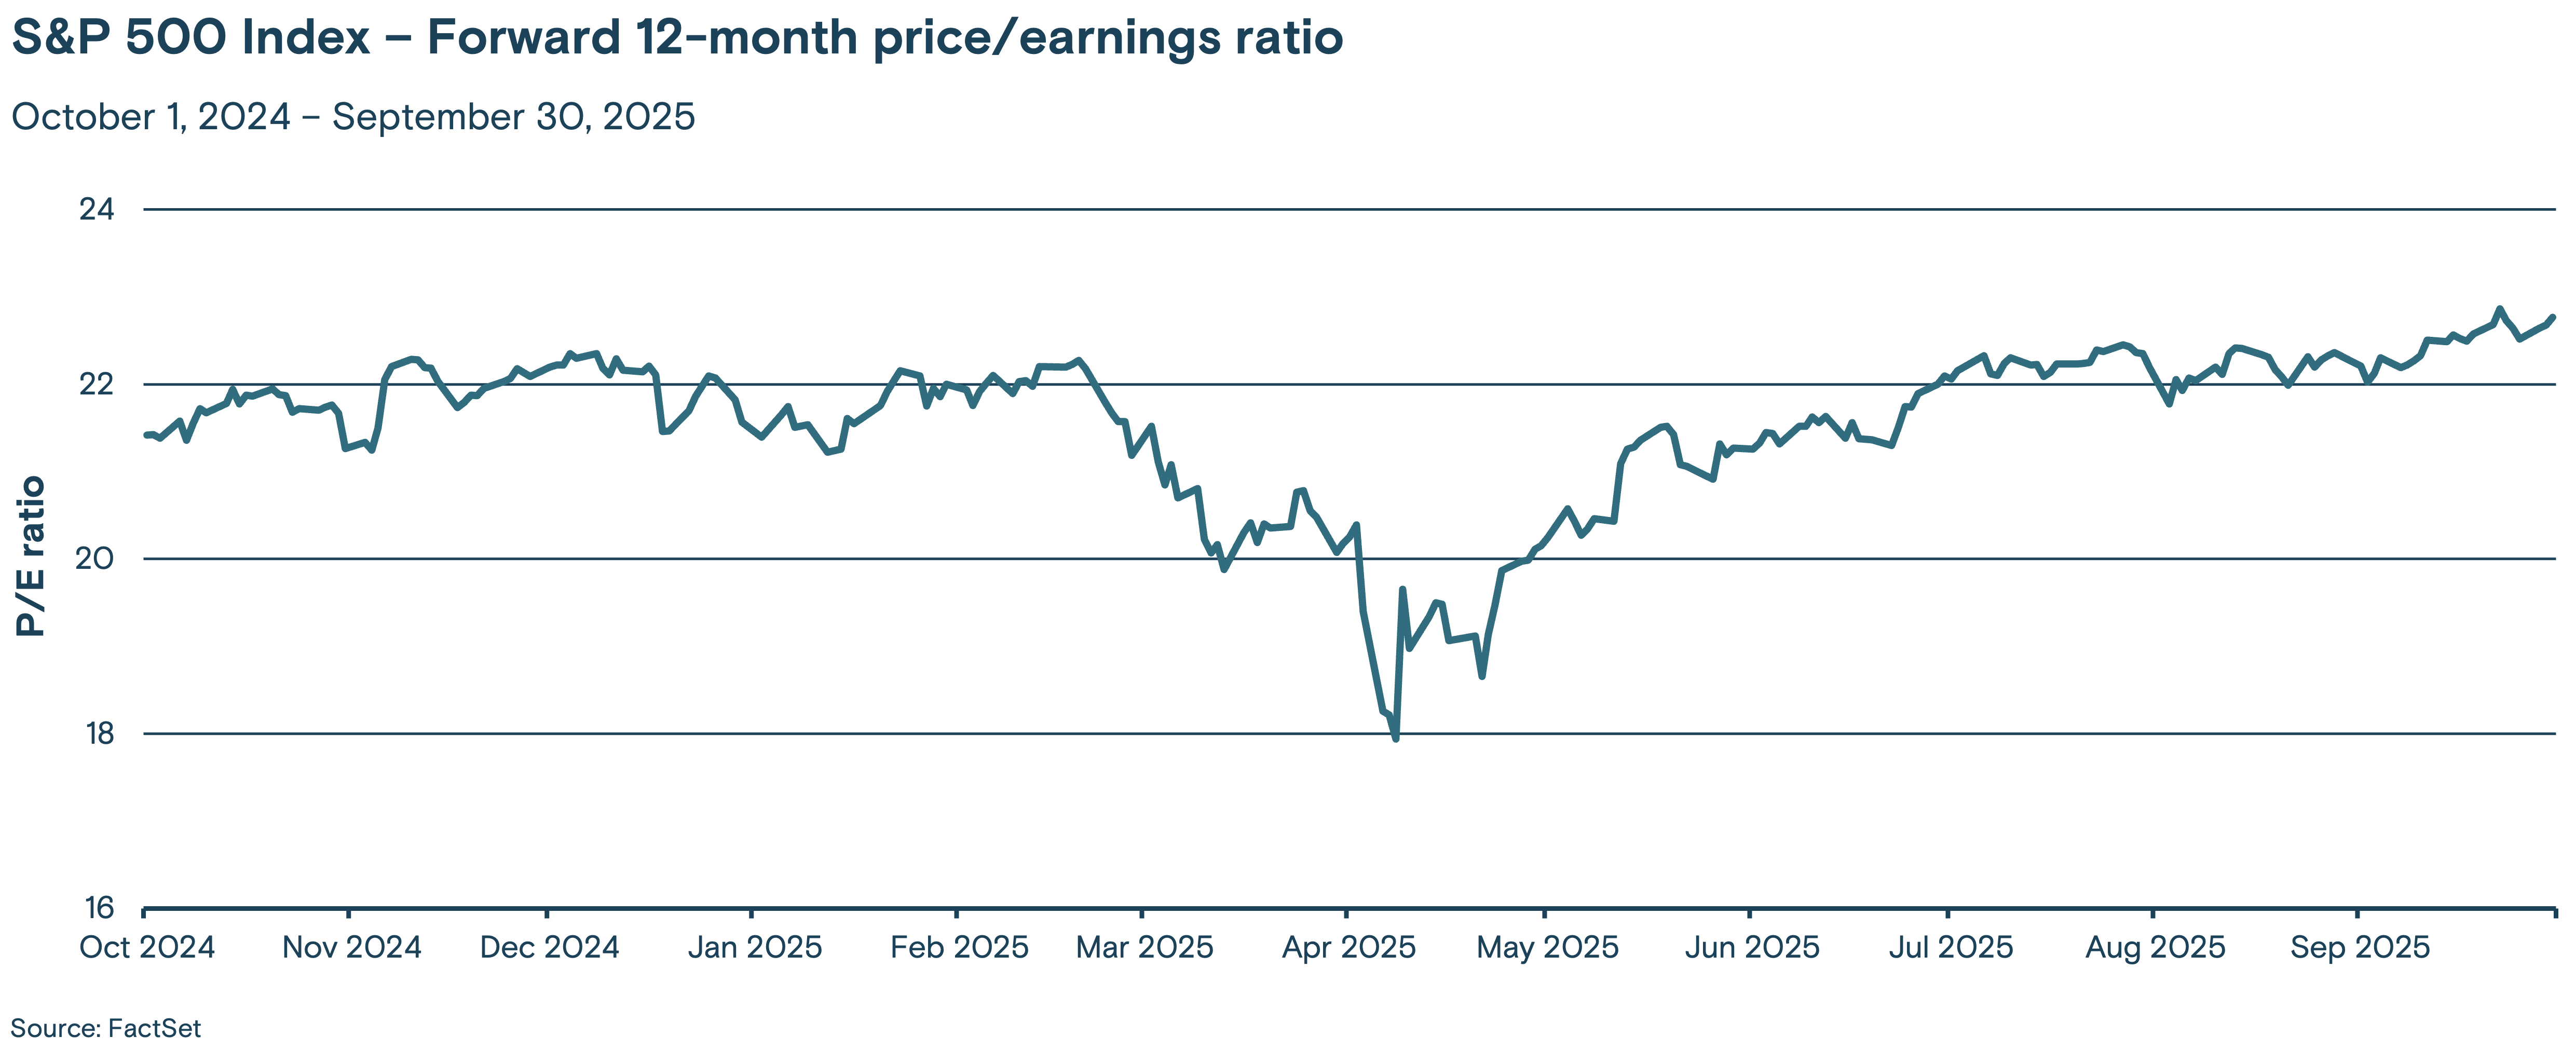
The forward PE ratio uses the forecasted earnings per share of the company over the next 12 months for calculating the price-earnings ratio. It is calculated by dividing the price per share by forecasted earnings per share over the next 12 months.
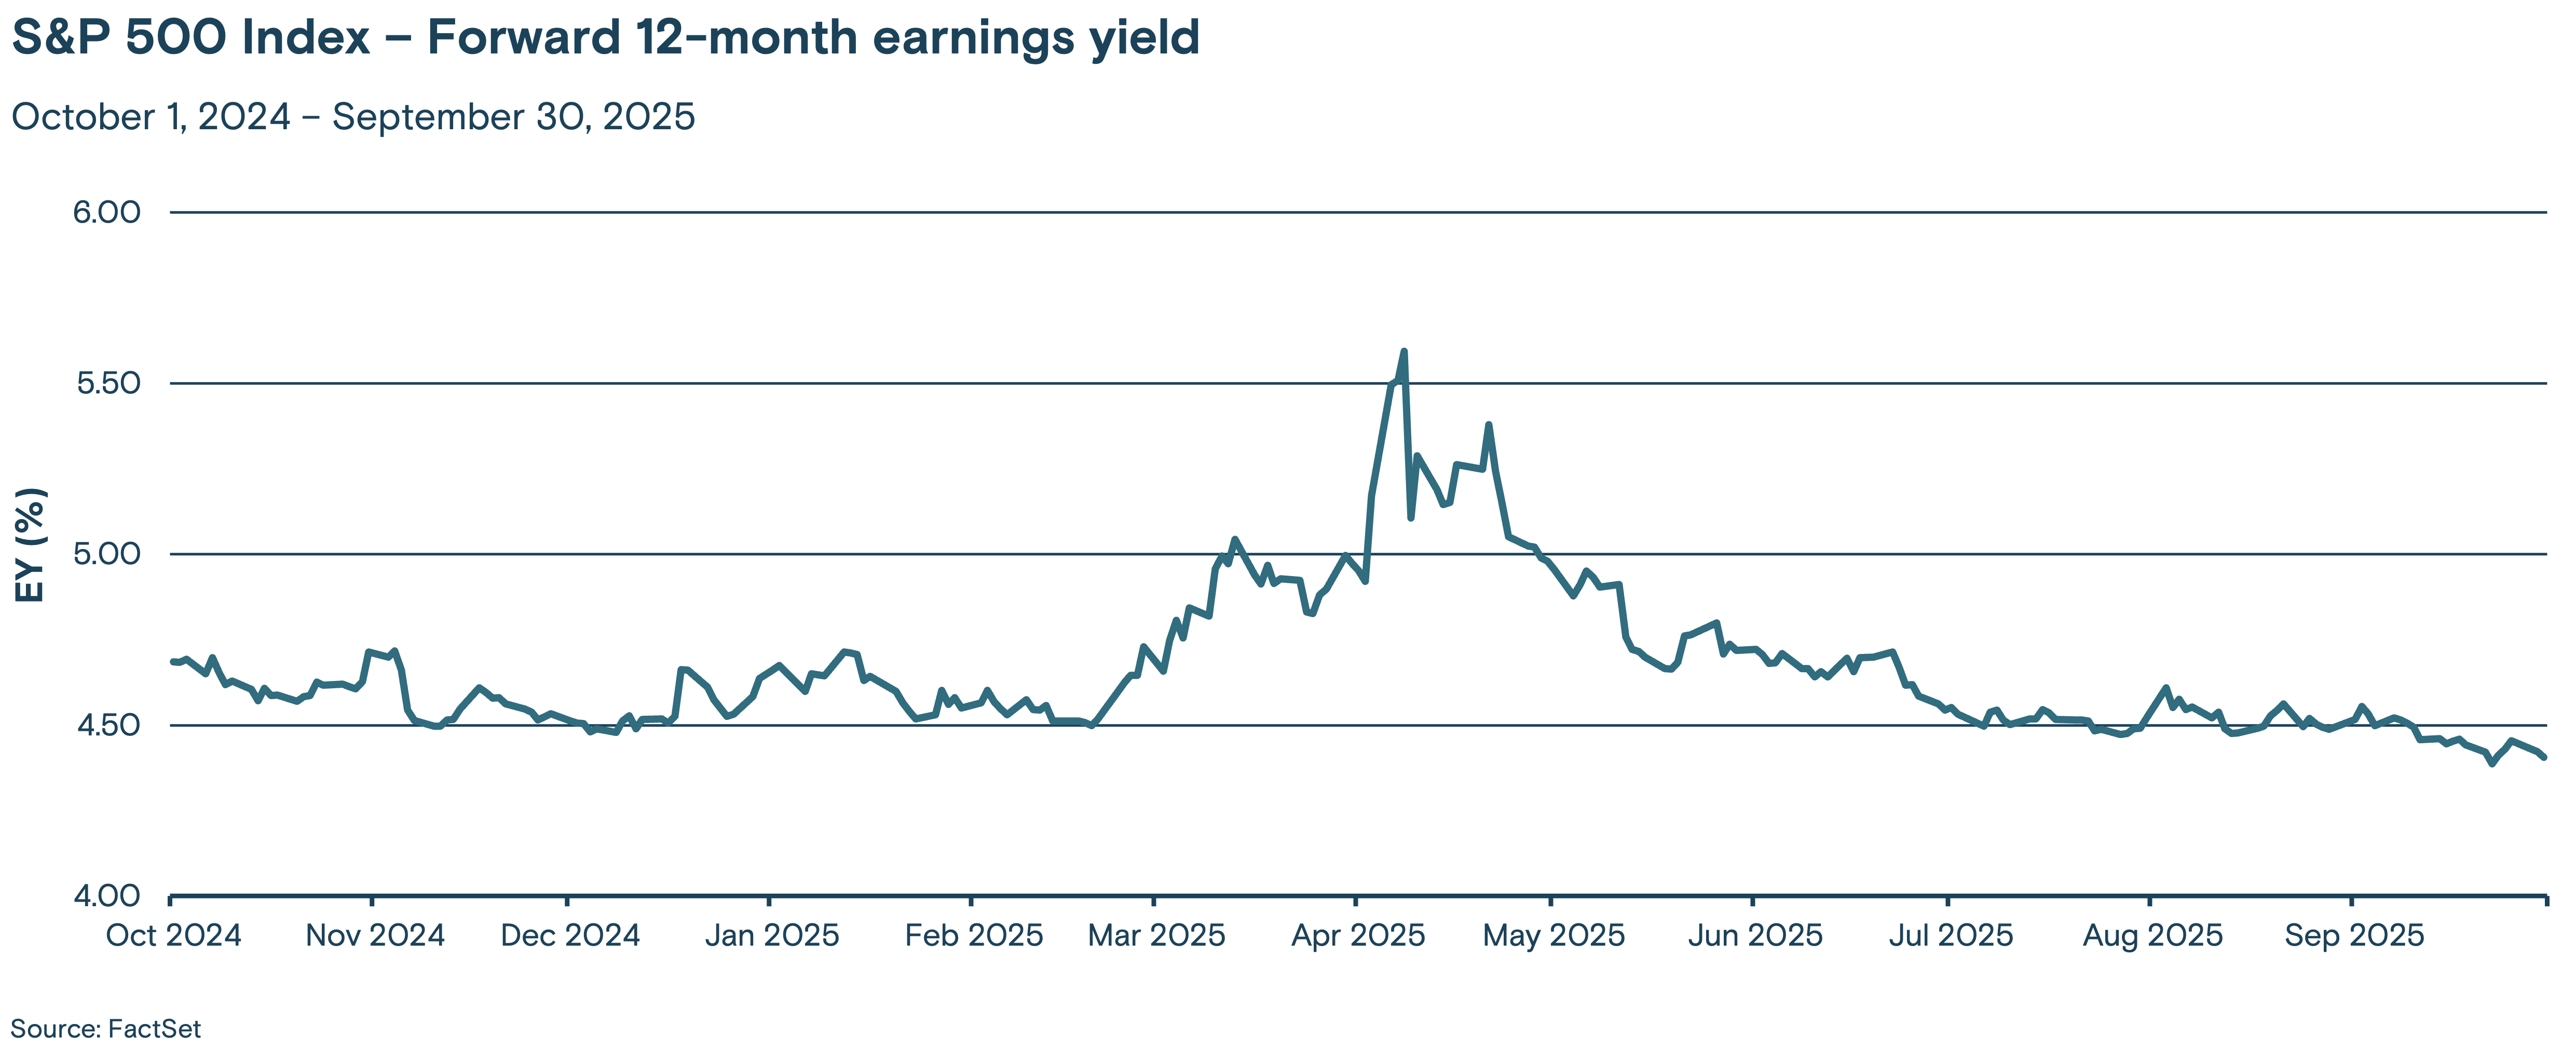
Earnings yield is the 12-month earnings divided by the share price. Earnings yield is the inverse of the P/E ratio. Earnings yield is one indication of value; a low ratio may indicate an overvalued stock, or a high value may indicate an undervalued stock.
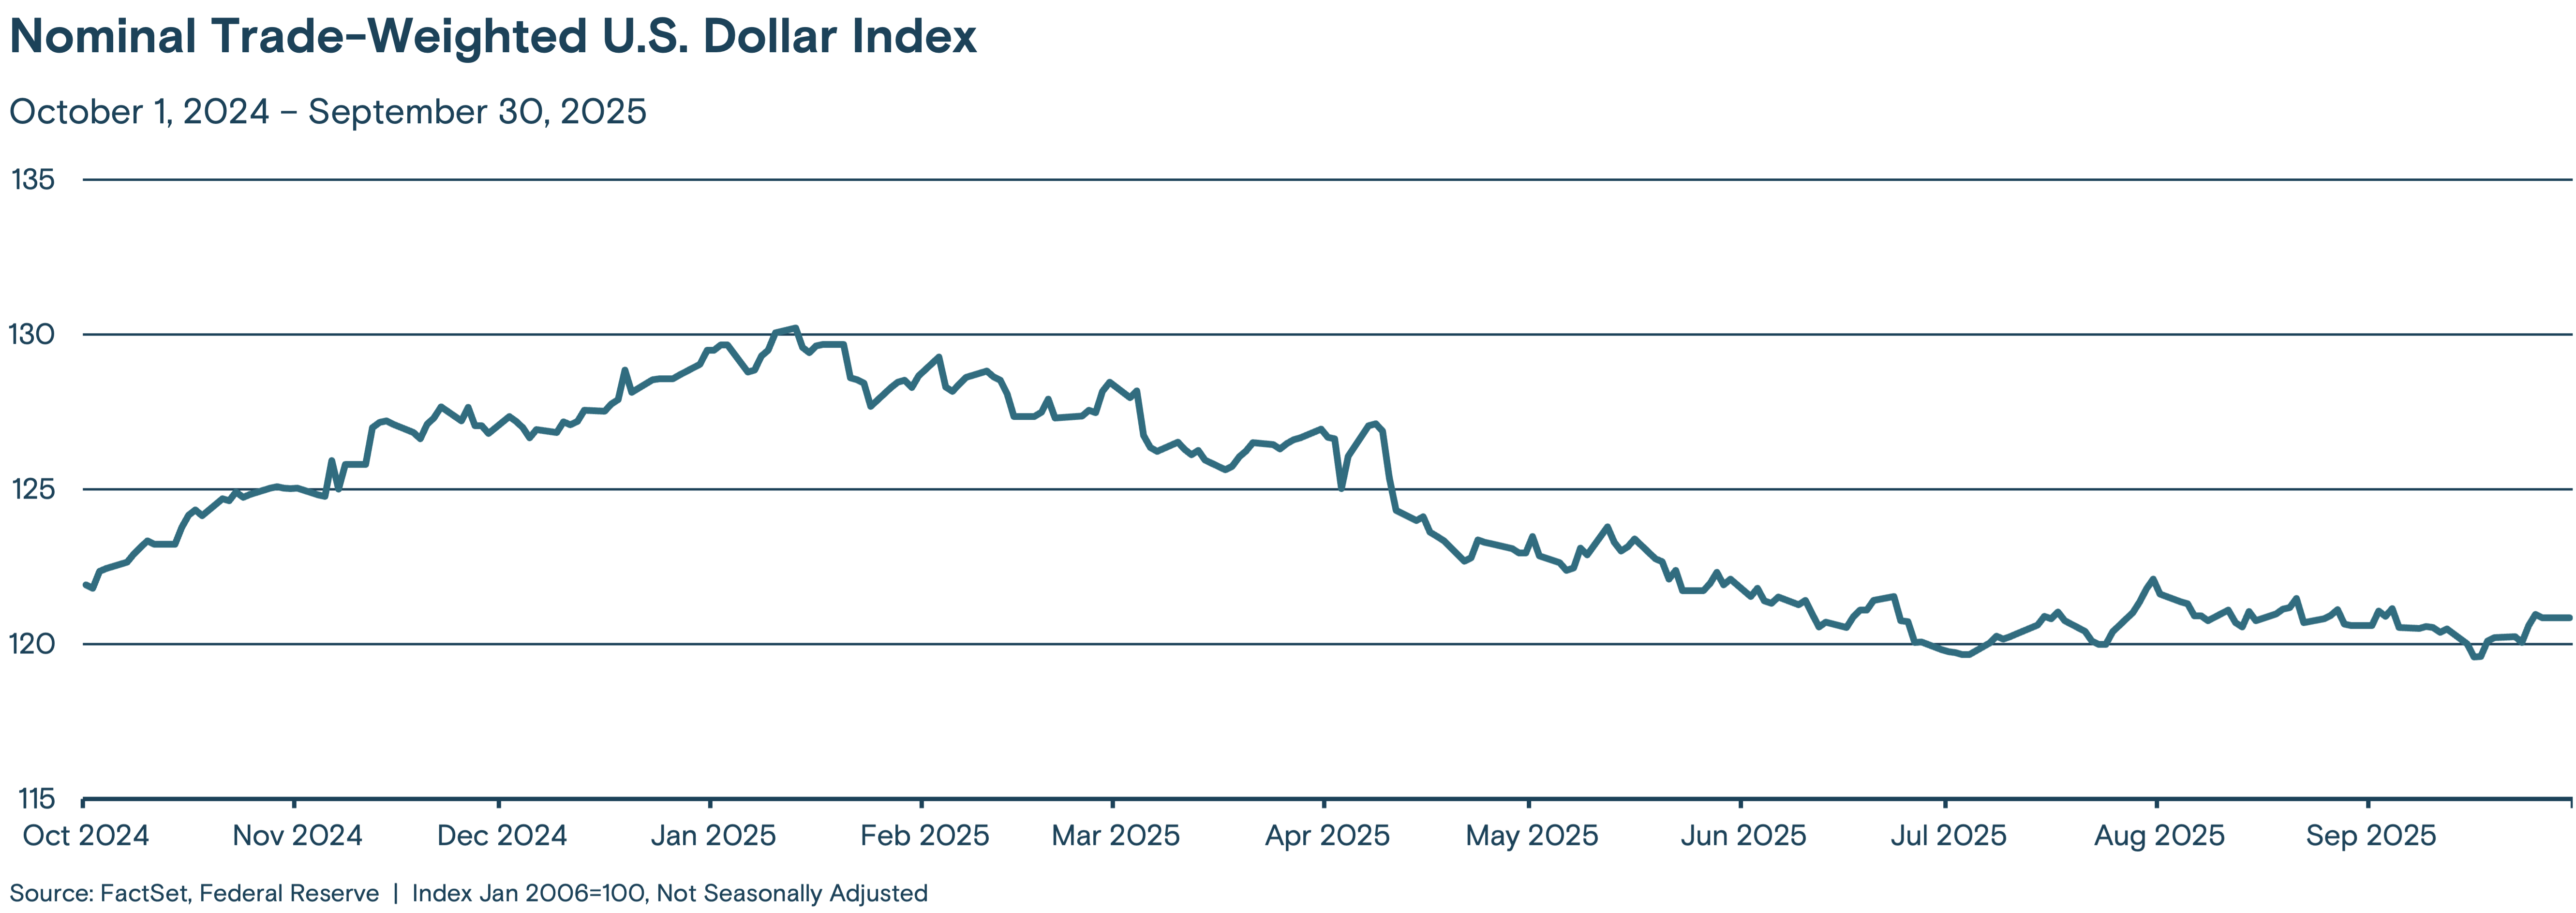
The Nominal Trade-weighted U.S. Dollar Index measures the value of the U.S. dollar based on its competitiveness versus trading partners.
Any indexes shown are unmanaged and do not reflect the typical costs of investing. Investors cannot invest directly in an index.
For more information on the index providers and their disclaimers, visit www.thriventfunds.com/privacy-and-security/index-provider-notices.html.
Past performance is not necessarily indicative of future results.