Tax Day is April 15, 2025. Visit the Tax Resource Center to help you prepare.

Three ways to invest in Thrivent funds

We’re here to help you invest with confidence.

MUTUAL FUNDS

Thrivent Account

You can purchase mutual funds right on our site with an online account.

Invest with a Thrivent account

  • Set up an account starting with as little as $50 per month.1
  • Access your online account at your convenience.
  • Purchase funds without transaction fees or sales charges.

MUTUAL FUNDS & ETFS

Financial Professional

For guidance when investing, ask a financial professional about investing in Thrivent mutual funds & ETFs.

Invest with a financial professional

  • Receive investment help from an experienced professional.
  • Build a relationship through in-person meetings.
  • Get help planning for life’s goals such as saving and retirement.
  • Additional fees may apply.

MUTUAL FUNDS & ETFS

Brokerage Account

If you already have a brokerage account, our mutual funds & ETFs can be purchased through online brokerage platforms by searching for Thrivent Mutual Funds and ETFs.

Invest with a brokerage account

  • Add Thrivent Mutual Funds and ETFs to your investments within your existing portfolio.
  • Take advantage of your account to keep your investments in one place.
  • Additional fees may apply.

Not quite ready?

We want you to invest your money wisely and with confidence.
Here are some other options that may help you.

  • Take our quiz to determine your personal investment style.
  • Talk to your financial advisor about ETFs.
  • Sign up for our monthly investing insights newsletter.


Need more help?

If you need assistance, we’re here to help. Reach out to us via the phone, email, and support page information below.


This ETF is different from traditional ETFs. Traditional ETFs tell the public what assets they hold each day. This ETF will not. This may create additional risks for your investment. For example:

 - You may have to pay more money to trade the ETF’s shares. This ETF will provide less information to traders, who tend to charge more for trades when they have less information.

 - The price you pay to buy ETF shares on an exchange may not match the value of the ETF’s portfolio. The same is true when you sell shares. These price differences may be greater for this ETF compared to other ETFs because it provides less information to traders.

 - These additional risks may be even greater in bad or uncertain market conditions.

 - The ETF will publish on its website each day a “Proxy Portfolio” designed to help trading in shares of the ETF. While the Proxy Portfolio includes some of the ETF’s holdings, it is not the ETF’s actual portfolio.

The differences between this ETF and other ETFs may also have advantages. By keeping certain information about the ETF secret, this ETF may face less risk that other traders can predict or copy its investment strategy. This may improve the ETF’s performance. If other traders are able to copy or predict the ETF’s investment strategy, however, this may hurt the ETF’s performance. For additional information regarding the unique attributes and risks of the ETF, see the Principal Risks section of the prospectus.

1 New accounts with a minimum investment amount of $50 are offered through the Thrivent Mutual Funds "automatic purchase plan." Otherwise, the minimum initial investment requirement is $2,000 for non-retirement accounts and $1,000 for IRA or tax-deferred accounts, minimum subsequent investment requirement is $50 for all account types. Account minimums for other options vary.

Thrivent ETFs may be purchased through your financial professional or brokerage platforms.

Contact your financial professional or brokerage firm to understand minimum investment amounts when purchasing a Thrivent ETF.

Now leaving ThriventFunds.com


You're about to visit a site that is neither owned nor operated by Thrivent Mutual Funds.

In the interest of protecting your information, we recommend you review the privacy policies at your destination site.

2024 MARKET REVIEW

A year of transitions

01/08/2025

WRITTEN BY:
Chief Investment Strategist
WRITTEN BY:
Steve Lowe, CFA,Chief Investment Strategist

Thrivent Asset Management contributors to this report: John Groton, Jr., CFA, Director of Administration and Materials & Energy Research; Matthew Finn, CFA, Head of Equity Mutual Funds; and Yale Nelson, CFA, CFP, investment product manager


Key points

Equities led tech

Artificial intelligence heavily influenced equity markets through much of the year.

Fixed income showed volatility

Company growth and inflation worries kept yields fluctuating.

Consumers strong but with challenges

Earnings went up, but jobs data slowed throughout the year.


2024 was a year of transition. The economy looks to have achieved a soft landing, monetary policy became supportive, a new U.S. president was elected, the Middle East became a growing source of geopolitical concern and artificial intelligence (AI) burst onto the investment scene. By and large, markets embraced these changes, with the S&P 500® Index setting 57 new record highs.

Despite consensus expectations in late 2023 that a recession was likely, the U.S. economy proved resilient, with gross domestic product (GDP) expected to rise 2.7% in 2024 and the economy poised for continued growth this year. Absent an abrupt turnaround, the U.S. Federal Reserve (Fed) thus achieved the much-coveted soft landing.

2024 also saw a significant and rapid transition in technological innovation and application. By the summer of 2024, 40% of Americans had used generative AI, and almost 10% used it every workday.1 Unsurprisingly, Nvidia Corp.—which makes the most sought-after computer chips for processing AI—made $91.2 billion in revenue in the first nine months of the year.2 In summary, 2024 was a year that many businesses, investors and consumers started to accept that AI would be a part of life and a likely significant source of profit.

Despite robust economic growth and surging investment in AI, the U.S. inflation rate declined, allowing the Fed to transition from a stable interest rate policy (its last rate increase was in July of 2023) to an accommodating one. On August 20, Fed Chairman Jerome Powell stated, “The time has come for policy to adjust” and in September the long-awaited, rate-cutting phase of the cycle began.

Last year also was a year of political transition. Donald Trump’s election, along with the Republican party gaining control of the Senate while maintaining control of the House of Representatives, ushered in a wave of expected policy changes. While economic policy is generally expected to be business-friendly, there is significant fiscal and foreign policy uncertainty. Outside the U.S., geopolitics and conflict remained a constant source of uncertainty, notably with the war in the Middle East expanding from Gaza to Lebanon, skirmishes between Israel and Iran and the collapse of the Syrian government.

Throughout all these transitions, the U.S. stock market remained generally bullish. On January 19, 2024, the S&P 500 Index set its first new high in two years and then did it again 56 times3 in the remainder of 2024. Despite—and in some cases because of—all the transitions, the U.S. economy continued to look like the most resilient and promising developed economy in the world.

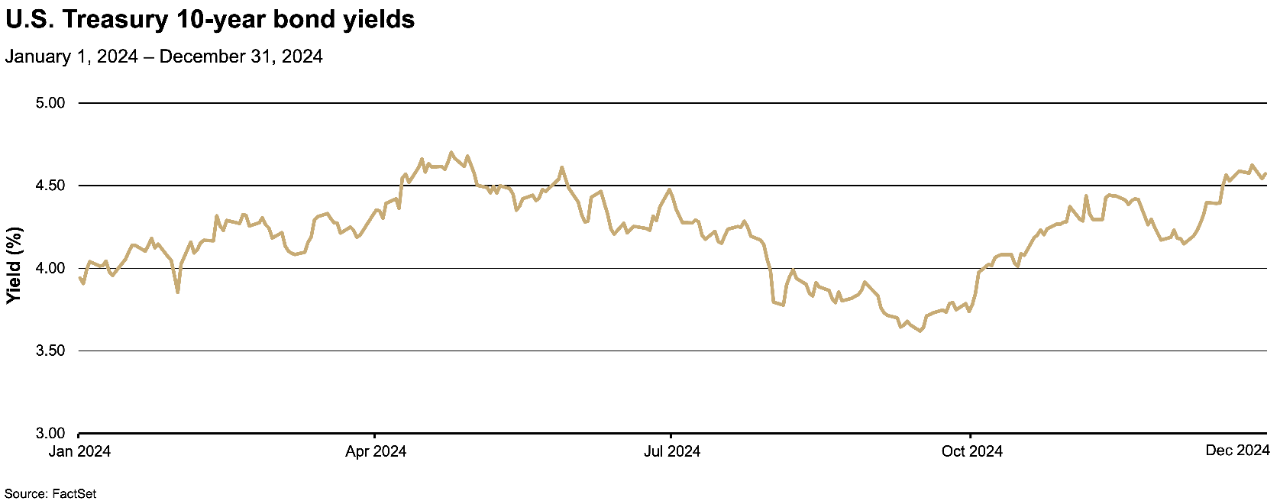
Treasury bonds were more volatile in 2024, with yields rising and falling with the ebbs and flows of growth and inflation expectations. Benchmark 10-year yields ended the year at 4.57%, 0.69% higher than at the start of the year. Corporate bonds were relatively more stable, benefiting from strong corporate fundamentals and from expectations that interest rates would remain higher for longer, thus sustaining strong demand from investors seeking their relatively attractive absolute yields. As an asset class, bonds (as measured by the Bloomberg U.S. Aggregate Bond Index, which tracks the performance of U.S. investment-grade bonds), delivered a modest return of 1.25% in 2024.

While there are many potential headwinds, we expect 2025 will confirm that the economy had a soft landing in 2024 and should see sustained and possibly accelerating growth in the year ahead. As such, we believe stocks can rally further in 2025, driven in part by continued gains in productivity (such as from AI) helping to fuel earnings growth as well as the new administration’s regulatory and tax policies. Risks remain, however, including higher interest rates roiling equity and bond markets, and a softening labor market.

The bond market faces more challenges in 2025, and thus we believe Treasuries will likely see another year of volatility. Whether it is concern about growth being too strong, fiscal policy being too loose, inflation being too sticky or just an abundance of supply, we believe bonds will remain more attractive for their yield and diversification benefits rather than for their potential to generate high total returns.

For more on the economy and our outlook for the markets, see Thrivent’s 2025 market outlook: Stay invested, but expect volatility, by Chief Investment Strategist Steve Lowe.
 

Drilling down

U.S. stocks set 57 new highs

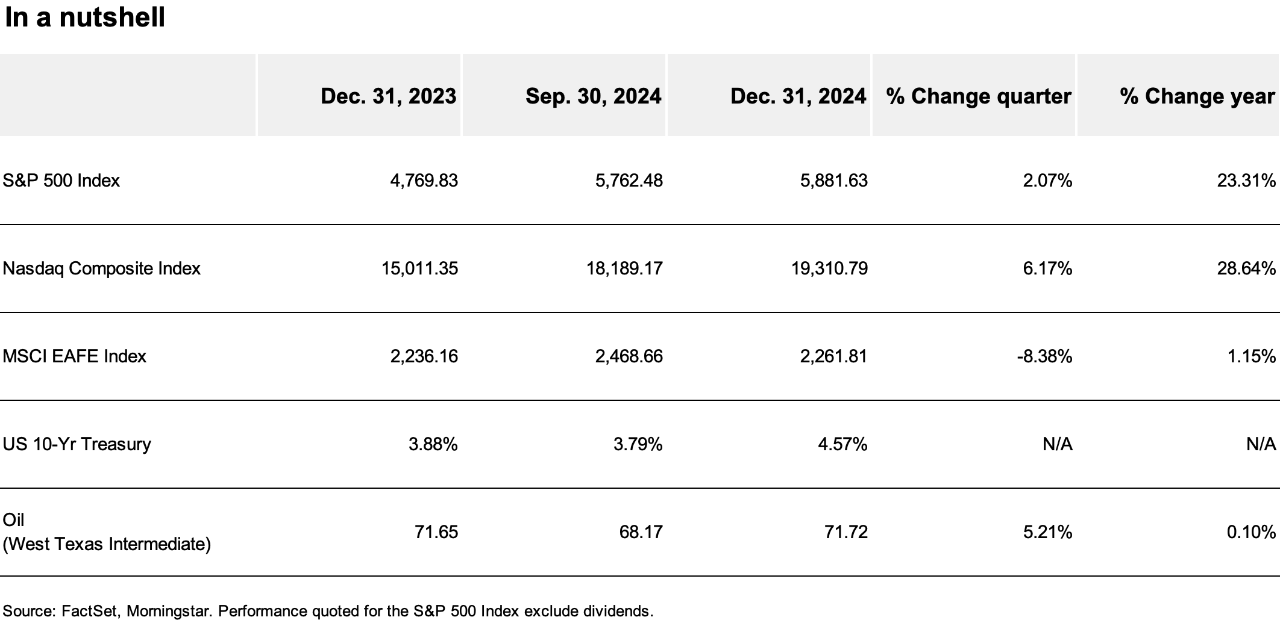
The S&P 500 Index rose 23.31% in 2024, marking its best-performing, two-year period since 1998. Stocks were supported by resilient economic growth, encouraging earnings and expectations that both inflation and interest rates had likely peaked. The total return of the S&P 500 Index (including dividends) was 25.02% over the period.

The NASDAQ Composite Index® was up 28.64% in 2024, supported by strong performance in technology and technology-related companies over the year, fueled partly by expectations that advances in AI would boost growth.

Most sectors rose in 2024

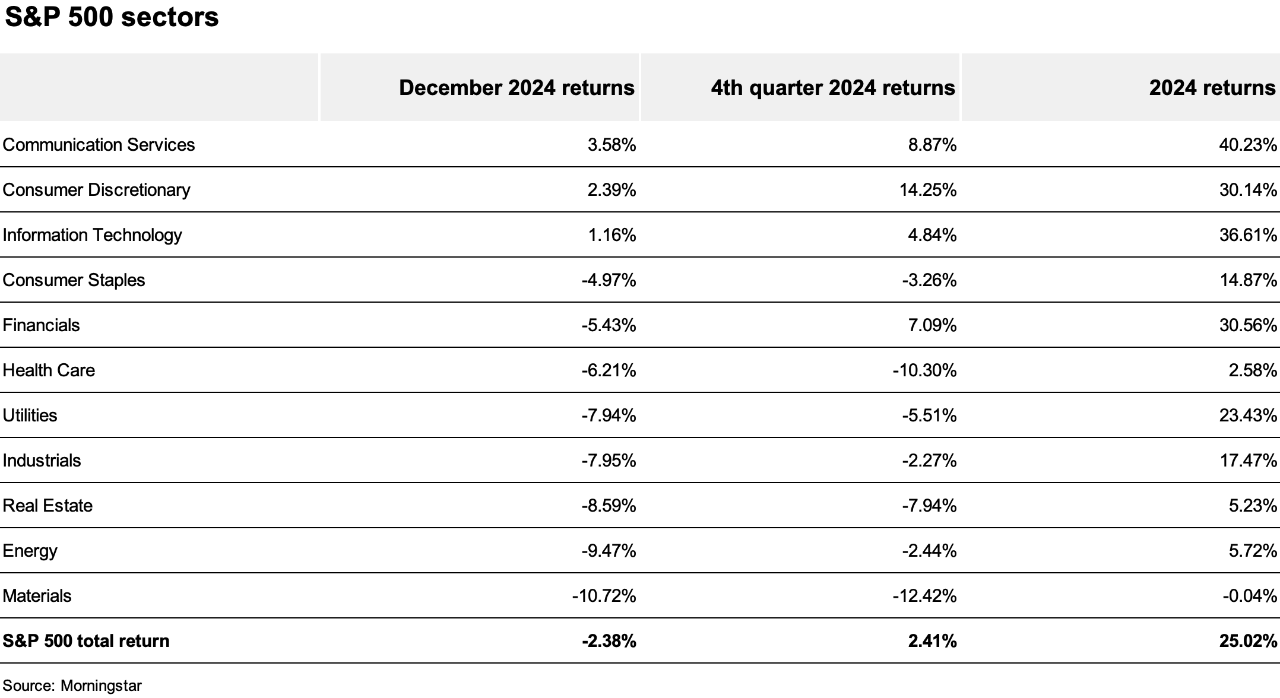
Of the S&P 500 Index’s 11 sectors, all but the materials sector generated positive returns in 2024. Communication services and information technology led the way, up an impressive 40.23% and 36.61%, respectively, over the year. While strength among the various sectors broadened in the latter half of 2024, December’s correction in the S&P 500 Index (-2.38%) weighed heavily on the more cyclical sectors, such as materials (-10.72%), industrials (-7.95%) and utilities (-7.94%).

The chart below shows the results of the 11 sectors for the past month, fourth quarter and calendar year 2024.


Retail sales were robust

Retail sales in November were up 3.8% from November 2023, according to the Department of Commerce report issued December 17, 2024. For the 11-month total (from January 2024 through November 2024), retail sales were up 2.9% from the same period in 2023.

The January-to-November 2024 rise in retail sales was driven by non-store retailers (primarily online sales), which rose 7.9% over the same period in 2023, and miscellaneous store retailers, which rose 5.6%. While most business sectors saw gains in 2024, furniture and home furnishing sales were negative, down 3.3% relative to the same period last year as a slower housing market weighed on home-related purchases.

Job growth slowed, earnings rose

The job market slowed during 2024, averaging 180,364 new jobs per month between January and November, down from 251,083 a month in 2023.4 But November’s employment report, released in early December, showed 227,000 new jobs were created during the month as payrolls bounced back from the impact of hurricanes and strikes the prior month.

The unemployment rate climbed higher in the first half of the year, from 3.7% in January to a peak of 4.3% in July, but stabilized in a 4.1-4.2% range during the second half of the year.5

Average hourly earnings rose steadily over the year. While there were some weaker months in February and over the summer, wages generally rose between 3-4% year over year.

10-year Treasury yields rose

Benchmark 10-year U.S. Treasury yields rose 0.69% in 2024, from 3.88% at the end of December 2023 to 4.57% at the end of December 2024—the fourth consecutive year of rising yields. The path of yields largely followed expectations for economic growth and inflation, rising in the early months as the outlook improved and declining in the summer months as fears about slowing growth returned.

However, 10-year yields ended the year near their 2024 highs (4.71% on April 25), and the yield curve steepened, reaching its steepest level since 2022. The steepening of the yield curve was driven both by short-dated Treasury yields following the Fed lower, and longer-dated yields rising on optimism for economic growth, concerns about potentially inflationary policy such as tariffs from the incoming administration, and uncertainty about fiscal spending and the U.S. government deficit.

The Bloomberg U.S. Aggregate Bond Index rose a modest 1.25% in 2024, largely due to the current yield offered by the index’s bonds.

Corporate earnings projections rose

Corporate 12-month earnings projections for the S&P 500 Index continued to rise, up 12.16% in 2024. Rising earnings projections were fueled by robust growth, expectations for stronger growth in the year ahead, optimism for rising productivity and a favorable outlook for many of the largest technology and technology-related companies.

Forward P/E ratios rose, earning yields fell

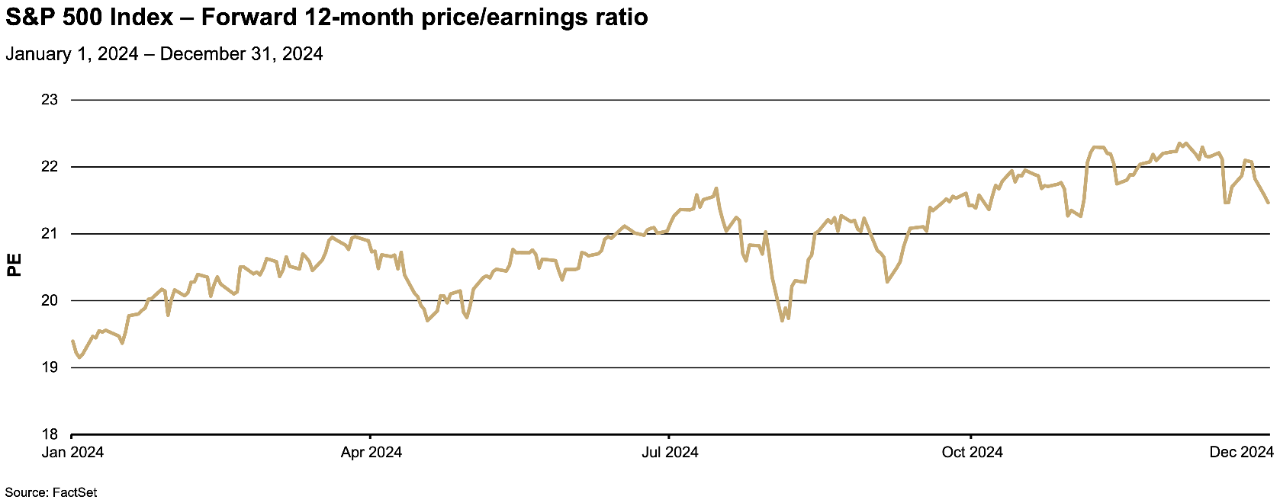
The forward 12-month price-earnings ratio (P/E) of the S&P 500 Index rose in 2024, from 19.53 at the end of December 2023 to 21.47 at the end of December 2024. A higher P/E means stocks are more expensive relative to their earnings per share.

The forward 12-month earnings yield for the S&P 500 Index, which is the inverse of P/E, fell 9.04% over the year. The 12-month forward earnings yield can be helpful in comparing equity earnings yields with current bond yields. The December-end 4.66% equity earnings yield was only slightly higher than the 4.57% yield provided by 10-year U.S. Treasuries.

The U.S. dollar strengthened

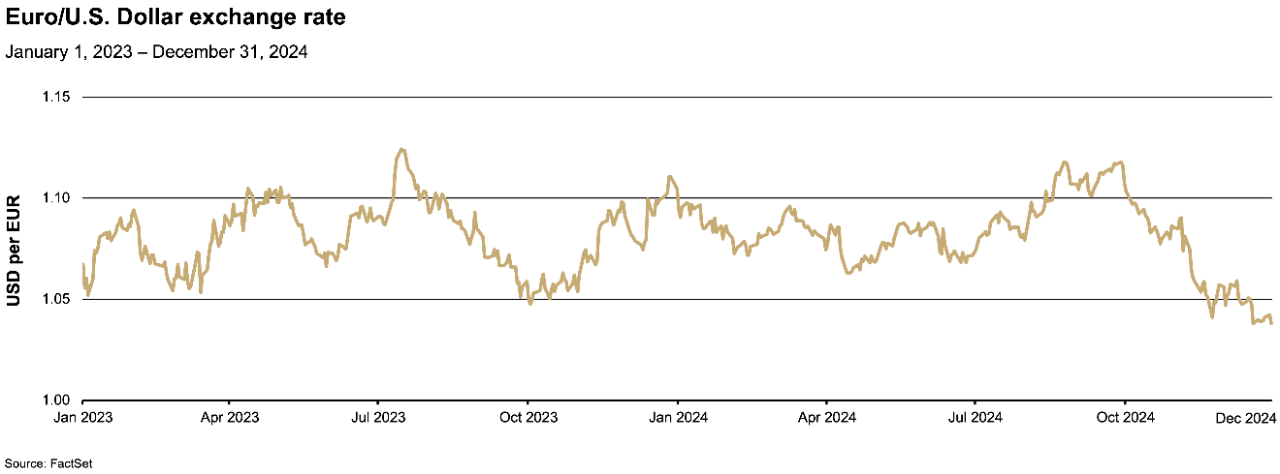
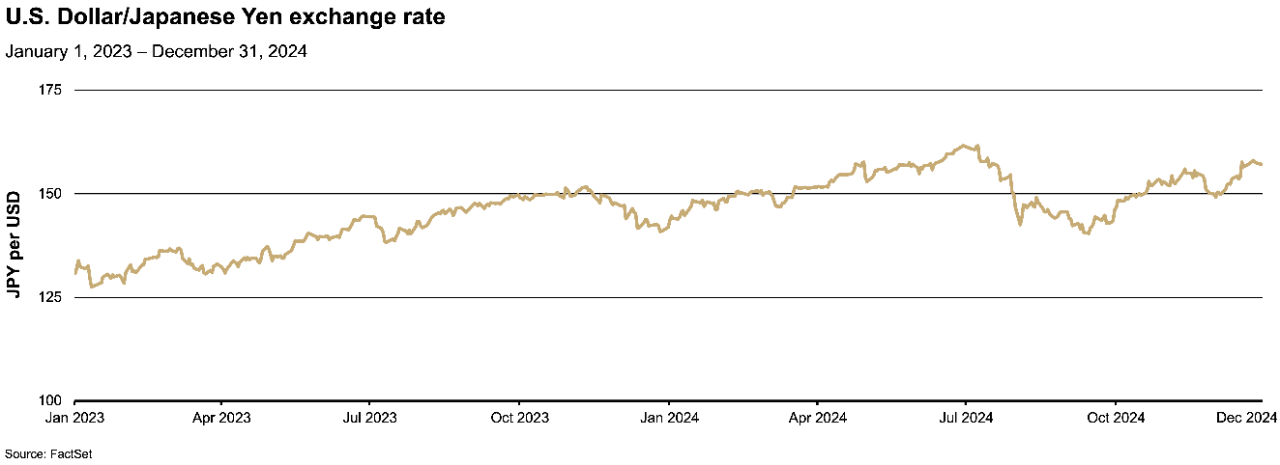
The U.S. dollar appreciated 6.26% versus the euro in 2024, mainly on expectations for relatively higher interest rates available in the U.S., while appreciating 11.48% versus the Japanese yen largely as a result of Japan abandoning its negative interest rate policy.

Gold prices surged

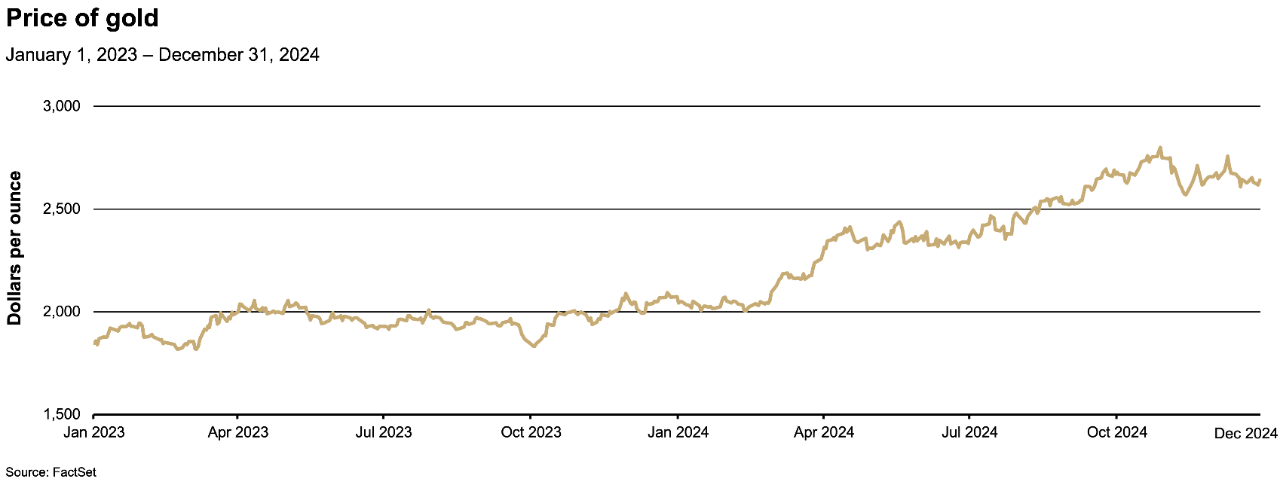
The price of gold surged 27.47% in 2024, its largest rise in 14 years despite a stronger U.S. dollar and rising Treasury yields. Demand for safe-haven assets amidst geopolitical uncertainty was supportive of gold prices, as was steady demand from foreign central banks. Additionally, expectations for lower interest rates supported the commodity, given that lower bond yields reduce the opportunity cost of holding commodities like gold, which don’t pay a yield.

Oil prices were relatively stable

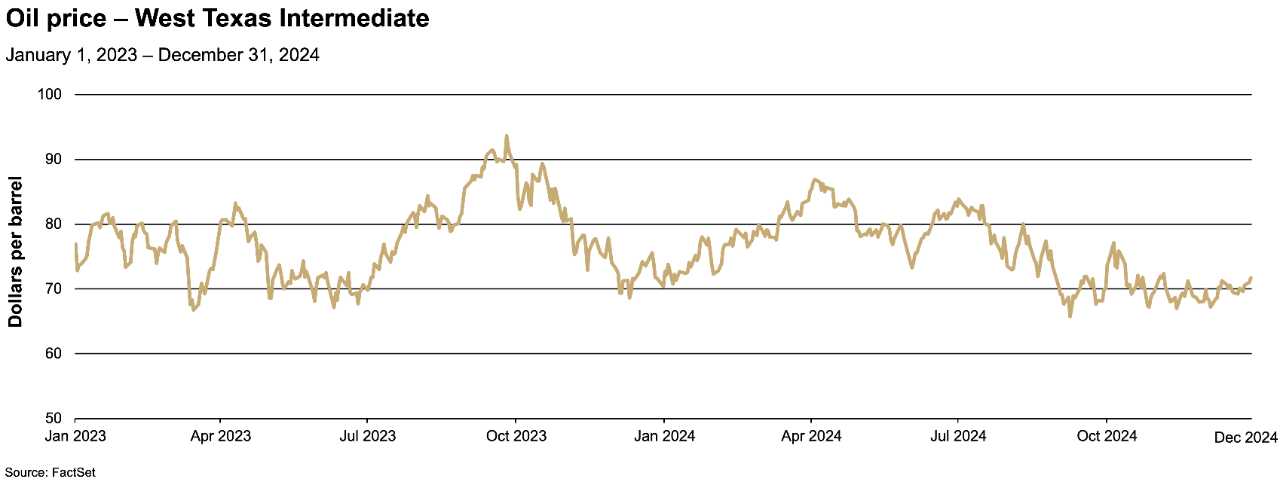
The price of a barrel of West Texas Intermediate (WTI), a grade of crude oil used as a benchmark in oil pricing, rose a modest 0.10% in 2024. Despite the ongoing conflict in Ukraine and escalating tension in the Middle East, WTI remained within a range of approximately $65-$85 over the year. Political risk and supply cuts from OPEC+ (a consortium of oil-producing nations including Saudi Arabia and Russia) provided support to oil prices, while concerns about the pace of global economic growth kept prices contained.

International equities lagged

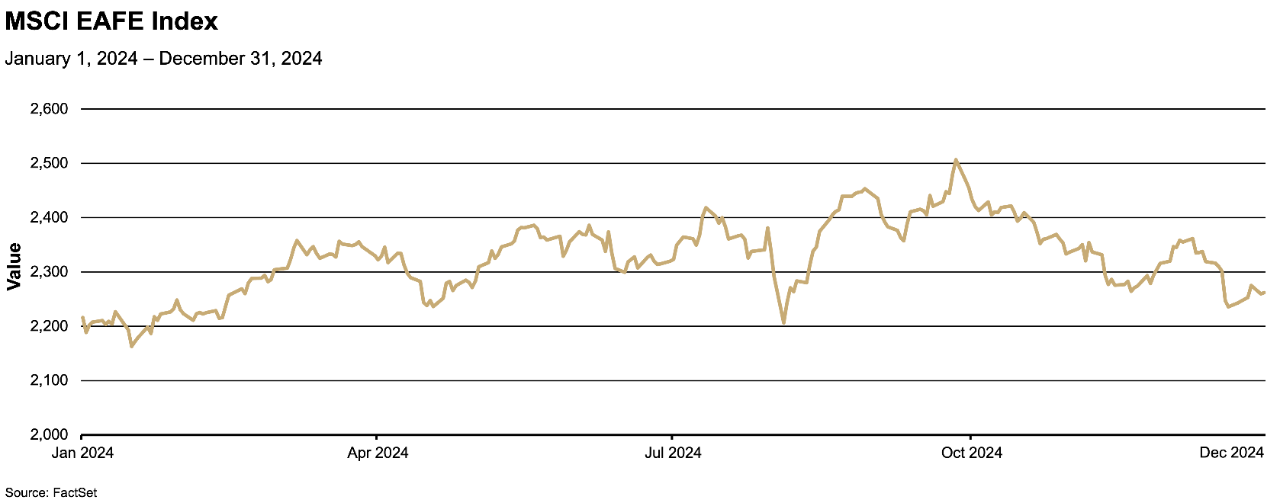
International equities underperformed U.S. equities over much of the year, largely due to generally weaker economic growth outside of the U.S. The MSCI EAFE Index rose just 1.15% in 2024, from 2,236.16 at the end of December 2023 to 2,261.81 at the end of December 2024.

Before making a change in your investment portfolio, you may wish to consult with a financial professional to determine how that may align with your long-term goals and objectives.

What can you expect from the economy and the markets in the months ahead? Take a look at Thrivent’s 2025 market outlook: Stay invested, but expect volatility by Chief Investment Strategist Steve Lowe.

Media contact: Callie Briese, 612-844-7340; callie.briese@thrivent.com

All information and representations herein are as of 01/08/2025, unless otherwise noted.

The views expressed are as of the date given, may change as market or other conditions change, and may differ from views expressed by other Thrivent Asset Management, LLC associates. Actual investment decisions made by Thrivent Asset Management, LLC will not necessarily reflect the views expressed. This information should not be considered investment advice or a recommendation of any particular security, strategy or product. Investment decisions should always be made based on an investor's specific financial needs, objectives, goals, time horizon, and risk tolerance.

This article refers to specific securities which Thrivent Mutual Funds may own. A complete listing of the holdings for each of the Thrivent Mutual Funds is available on thriventfunds.com.

The S&P 500® Index is a market-cap weighted index that represents the average performance of a group of 500 large-capitalization stocks.

NASDAQ – National Association of Securities Dealers Automated Quotations – is an electronic stock exchange with more than 3,300 company listings.

The Bloomberg U.S. Aggregate Bond Index is an unmanaged index considered representative of the U.S. investment-grade, fixed-rate bond market.

MSCI EAFE Index tracks the performance of developed-economy stocks in Europe, Australasia and the Far East.

The forward PE ratio uses the forecasted earnings per share of the company over the next 12 months for calculating the price-earnings ratio. It is calculated by dividing the price per share by forecasted earnings per share over the next 12 months. Earnings yield is the 12-month earnings divided by the share price. Earnings yield is the inverse of the P/E ratio. Earnings yield is one indication of value; a low ratio may indicate an overvalued stock, or a high value may indicate an undervalued stock.

Any indexes shown are unmanaged and do not reflect the typical costs of investing. Investors cannot invest directly in an index.

Past performance is not necessarily indicative of future results.

1 Greg Rosalsky, “Americans are using AI at fairly high rates. What does this mean for the economy?,” www.npr.org/sections/planet-money/2024/10/07/g-s1-26429/americans-using-ai-fairly-high-rates-what-does-this-mean-for-economy, October 8, 2024, (January 3, 2025).

“How the stock market defied expectations in 2024, by the numbers,” www.pbs.org/newshour/economy/how-the-stock-market-defied-expectations-in-2024-by-the-numbers, December 26, 2024, (January 3, 2025).

3 Karen Langley, “Stocks cap best two years in a quarter-century,” www.wsj.com/finance/stocks/stocks-on-pace-for-best-two-years-in-a-quarter-century-c5b5f9b3, December 31, 2024, (January 3, 2025).

4 Source: U.S. Bureau of Labor Statistics. Data as of November 30, 2024.

5 Source: U.S. Bureau of Labor Statistics. Data as of December 28, 2024.

Related Insights